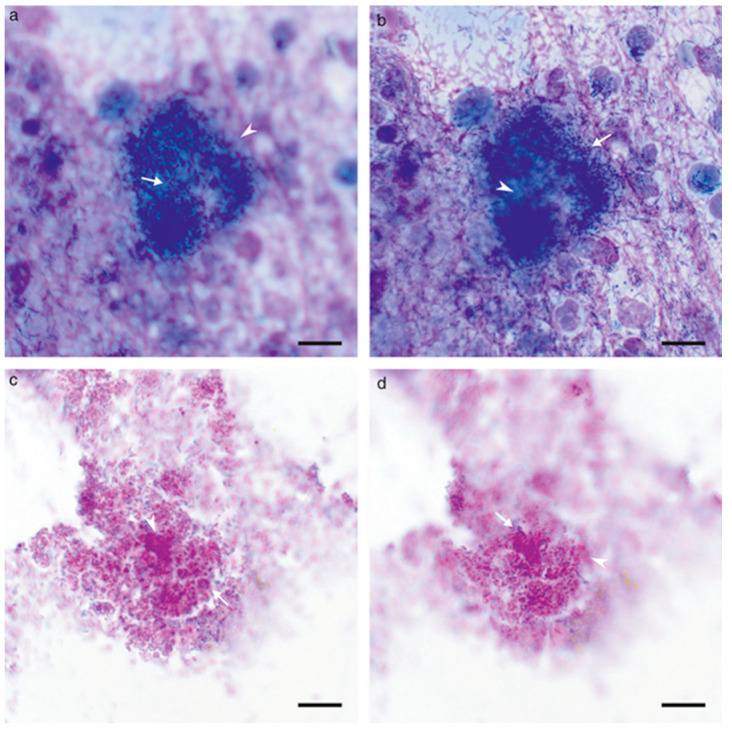
Figure 2.

Comparison of bacterial aggregates across two focal planes from slides assessed to have aggregate-associated infection. In-focus microorganisms are indicated with white arrows; out-of-focus microorganisms indicated with the white arrowheads. Note the difference in the focus of organisms across focal planes. Microorganisms are high-density and clustered within a well-defined stained matrix, versus organisms on the periphery, which are not associated with the matrix. Both samples are from the same ear. (a,b) modified Wright’s stain, (c,d) periodic acid-Schiff stain. (a–d) 100× (oil) objective, bar = 10 μm. Reprinted from [20], Copyright (2021), with permission from John Wiley and Sons.
