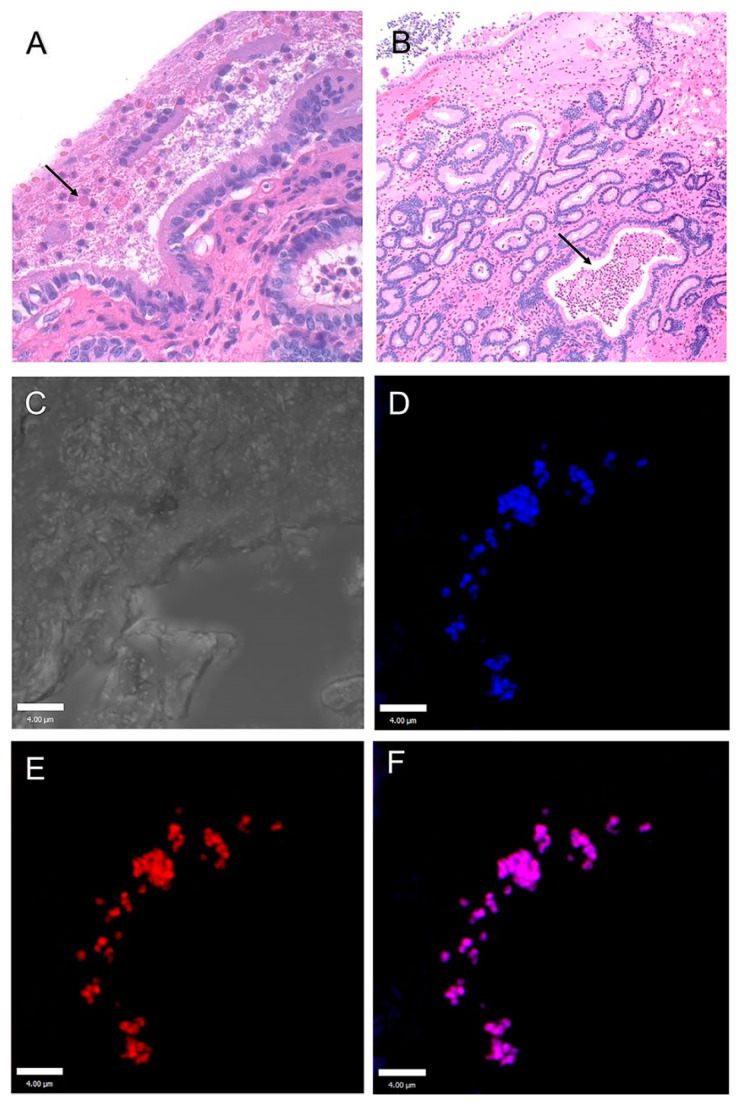
Figure 5.
Detection of tissue-adherent P. aeruginosa in endometrium samples. H&E image of the endometrium with tissue-adherent P. aeruginosa on the luminal surface (black arrow) (A) and deep in the endometrial glands (black arrow) (B). (C) Differential interference contrast image of an endometrial gland below the luminal surface of the uterus; this is similar to the area represented in panel B by the black arrow. Immunofluorescent staining of tissue-adherent P. aeruginosa with an anti-Pseudomonas antibody (Alexa Fluor 405) (D) and anti-Pel lectin (Texas red) (E) and merged image detecting the Pel exopolysaccharide colocalized with P. aeruginosa (F). Immunofluorescent images are projected images of Z-stacks as processed by Volocity image analysis software in which 0.5-μm scanning increments were performed through approximately 10 μm of tissue. The scale bar is 4 μm. Reprinted from: Ferris et al. 2017 [64].

