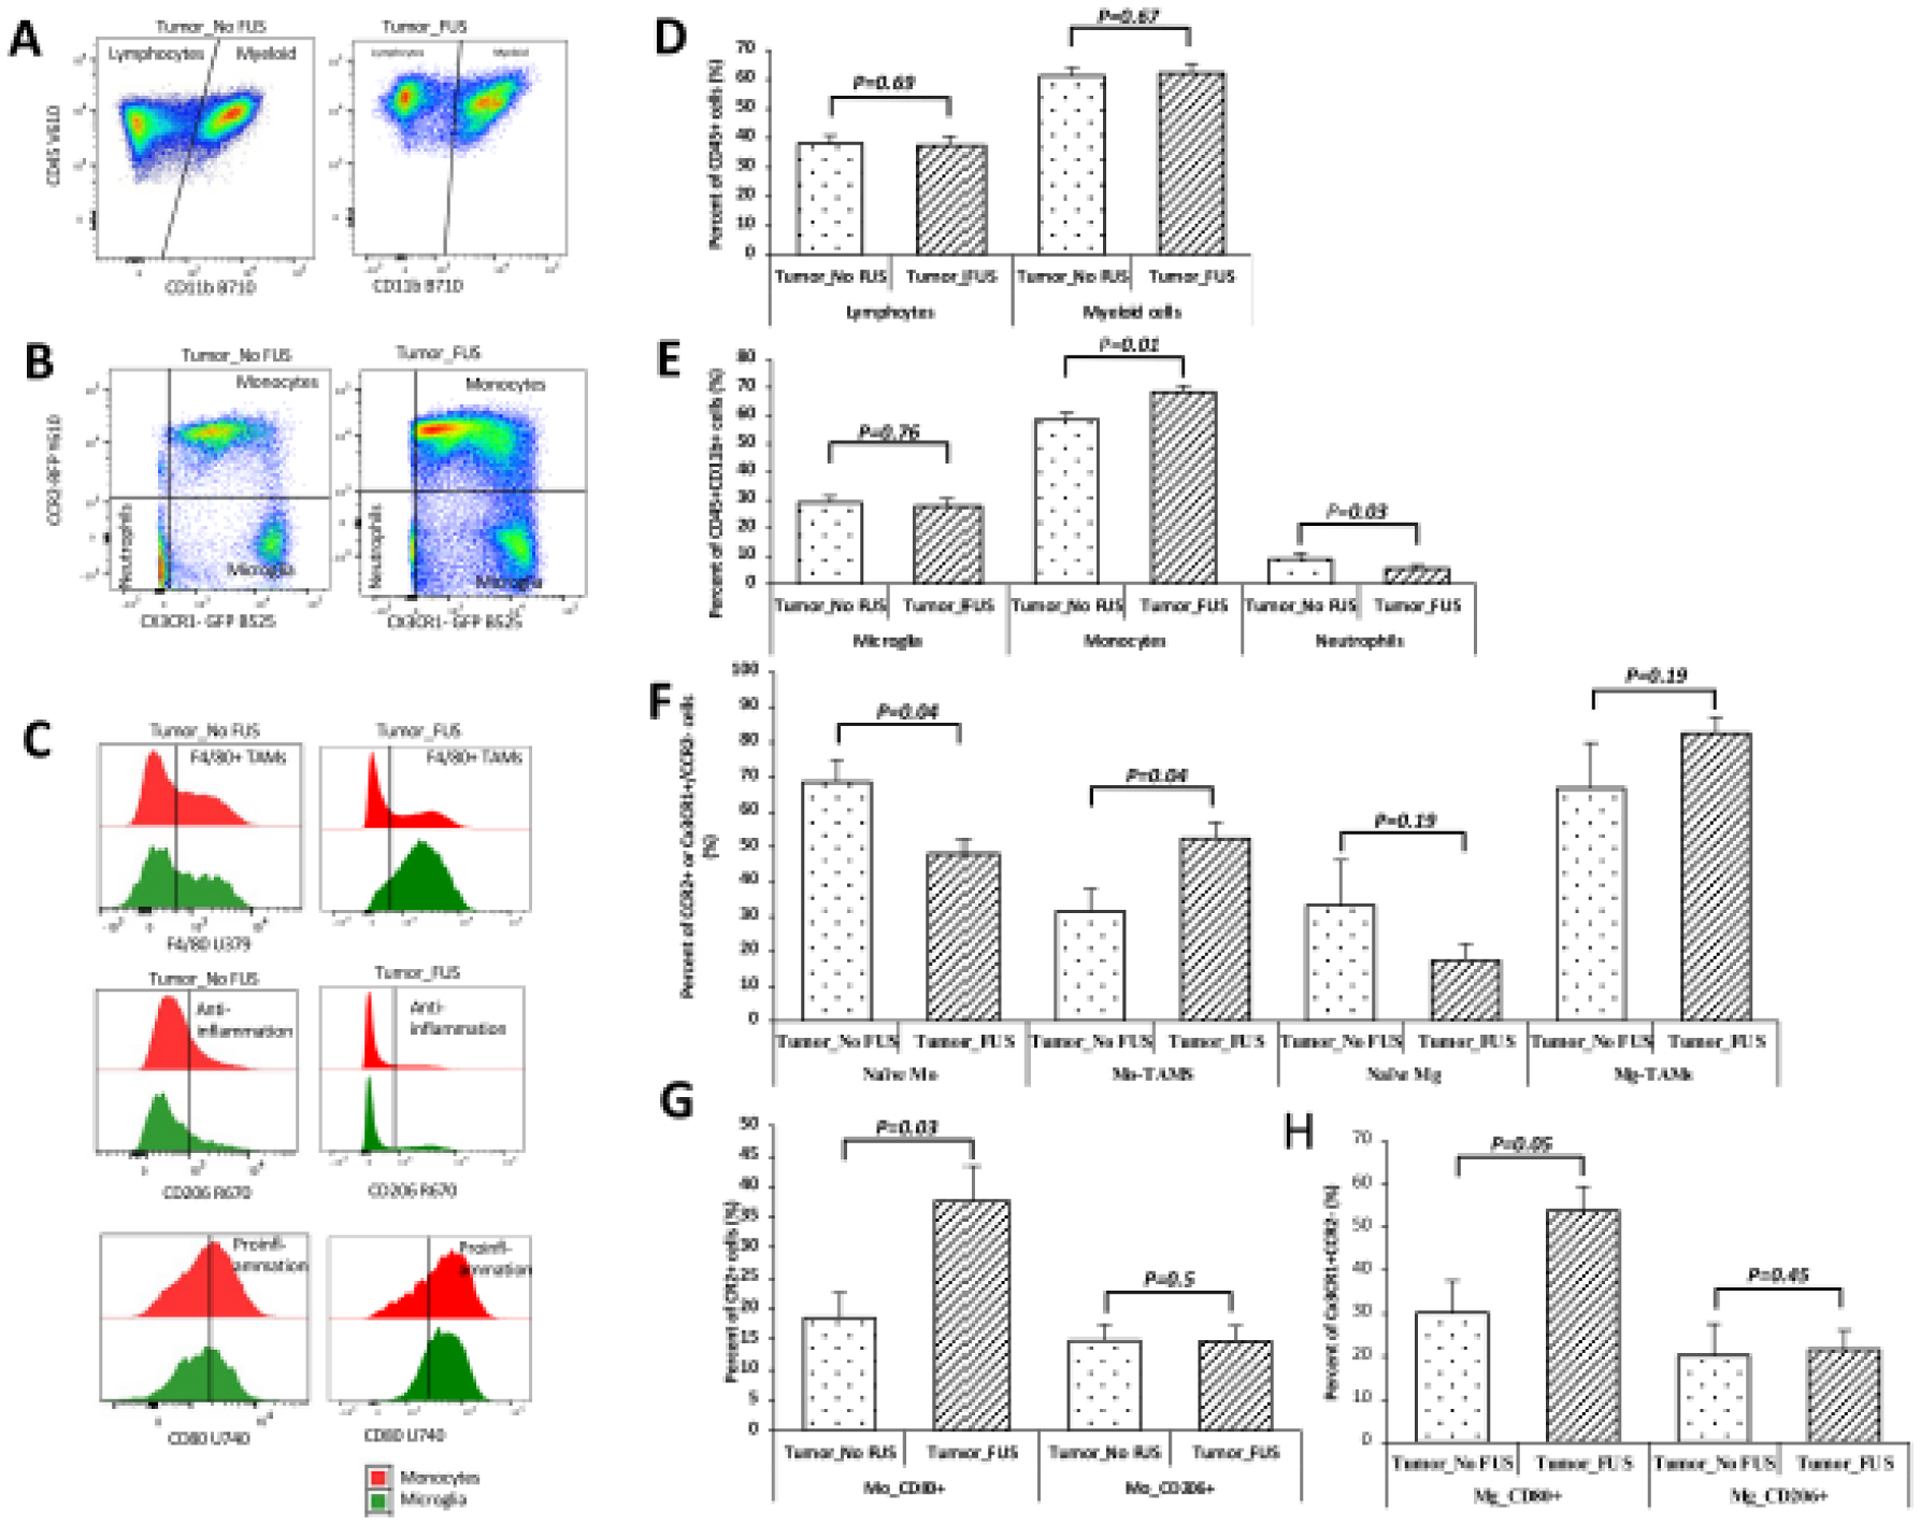
Figure 5. Effects of MRgFUS on the immune micro-enviroment of tumor tissue.

A: Dot plots of the CD45+Cd11b− lymphocytes and CD45+CD11b+ myeloid cells. B: Dot plots of the cells gated on CX3CR1-GFP and CCR2-RFP from myeloid cells, the tumor treated with FUS showed more cells in the monocytes quardrant. C: Histograms of the monocytes and microglia cells identified through markers of F4/80, CD80, and CD206. D-H: Quantification of the cell populations identified from A, B, and C. The animals treated with MRgFUS showed increased monocytes (p=0.01) and decreased proportion of neutrophils (p=0.03) compared to the Tumor_No FUS group. The proportions of lymphcytes (p=0.69), myeloid cells (p=0.67), and microglia (p=0.76) did not show any significant difference between the gliomas from the Tumor_No FUS and Tumor_FUS groups (D and E). Tumor_FUS group showed more monocytes differentiation: higher proportion of monocytes-derived TAMs (p=0.04), whereas microglia did not show changes in differentiation (p=0.19) (F). In the tumors treated with FUS, there were more proinflammation CD80+ cells both in CCR2+ monocytes (p=0.03) and CX3CR1+CCR2− microglia cells (p=0.05). (G, H). Abbreviation: Abbreviation: naïve-Mo: naïve monocytes; Mo: monocyte; Mg: microglia; Mo-TAMs: monocyte-derived tumor associated macrophages; naïve-Mg: maive microglia; Mg-TAMs: microglia-derived tumor associated macrophages.
