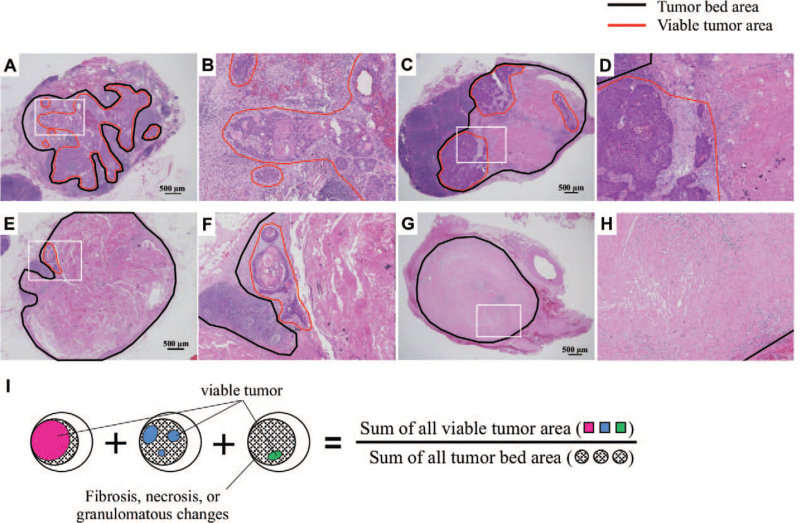
FIGURE 1.
Representative images of hematoxylin and eosin-stained lymph nodes (LNs) for each LN regression grade. A, Grade I: Viable tumor cells are observed in over 50% of the tumor bed area. B, Higher magnification of the white squared area of panel A. C, Grade II: Viable tumor cells are observed in 10%–50% of the tumor bed area. D, Higher magnification of the white squared area of panel C. E, Grade III: Viable tumor cells are observed in <10% of the tumor bed area. F, Higher magnification of the white squared area of panel E. G, Grade IV: No viable tumor cells observed in the tumor bed area. H, Higher magnification of the white squared area of panel G. The area enclosed by black lines indicates the tumor bed area, and the area enclosed by red lines indicates the viable tumor area. I, Schematic representation of the formula for calculating the total LN regression grade.

