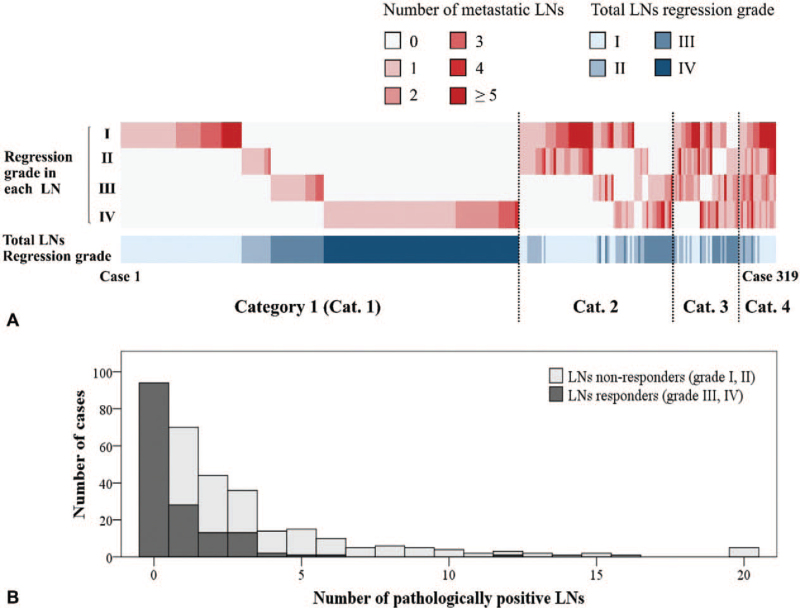
FIGURE 2.
A, Distribution of the lymph node (LN) regression grades in each patient, and of the total LN regression grade among 319 cases with clinically positive LNs. Shades of red are used to map the number of metastatic LNs in each regression grade, and shades of blue map the total LN regression grades. Dotted lines distinguish cases by the number of different regression grades exhibited by LNs in a single case. Cat. indicates category. B, Bar chart showing the number of patients with LNs responders and nonresponders by each number of pathologically positive LNs among 319 cases with clinically positive LNs. The white area represents the number of patients with nonresponders and the dark gray area represents the number of patients with responders.

