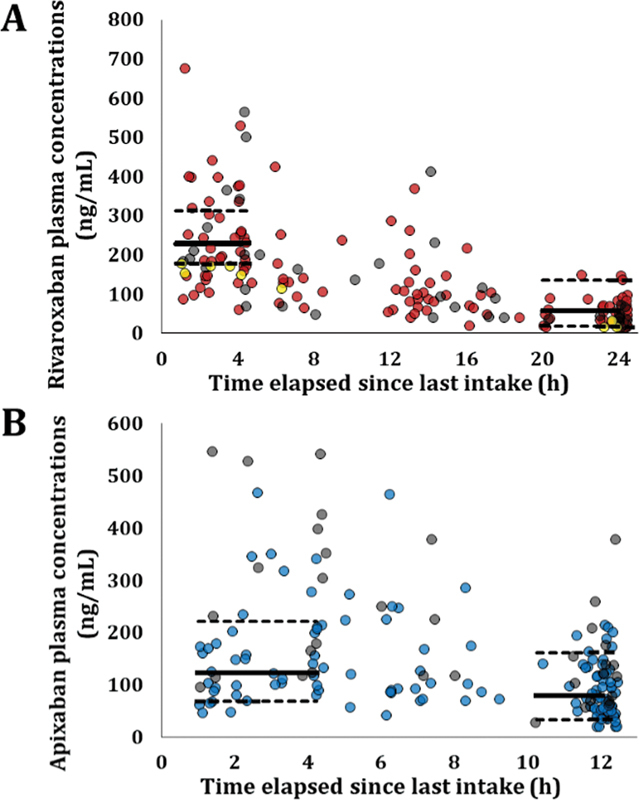
Fig. 1.

Plasma concentrations of rivaroxaban (A) and apixaban (B) in Adage patients as a function of time since the last oral intake. ( A ) Patients receiving rivaroxaban 10, 15, or 20 mg o.d. are represented with yellow, red, and grey circles, respectively (noteworthy, 10 mg off-labeled in AF). In order to facilitate interpretation, we represented the geometric mean C max and C min and the 5th–95th percentiles, i.e ., 229 ng/mL (5th–95th: 178–313) and 57 ng/mL (5th–95th: 18–136), as reported in ROCKET-AF patients (median age: 73 years) receiving 15 mg according to Girgis et al 21 with solid and dashed lines, respectively. ( B ) Patients receiving apixaban 2.5 or 5 mg b.i.d. are represented with blue and grey circles, respectively. We represented the median C max and C min and 5th–95th percentiles, i.e. , 123 ng/mL (5th–95th: 69–221) and 79 ng/mL (5th–95th: 34–162), as reported in patients receiving apixaban 2.5 mg b.i.d. in ARISTOTLE trial 11 (median age: 70 years), with solid and dashed lines, respectively. AF, atrial fibrillation; b.i.d., twice daily; o.d., once daily.
