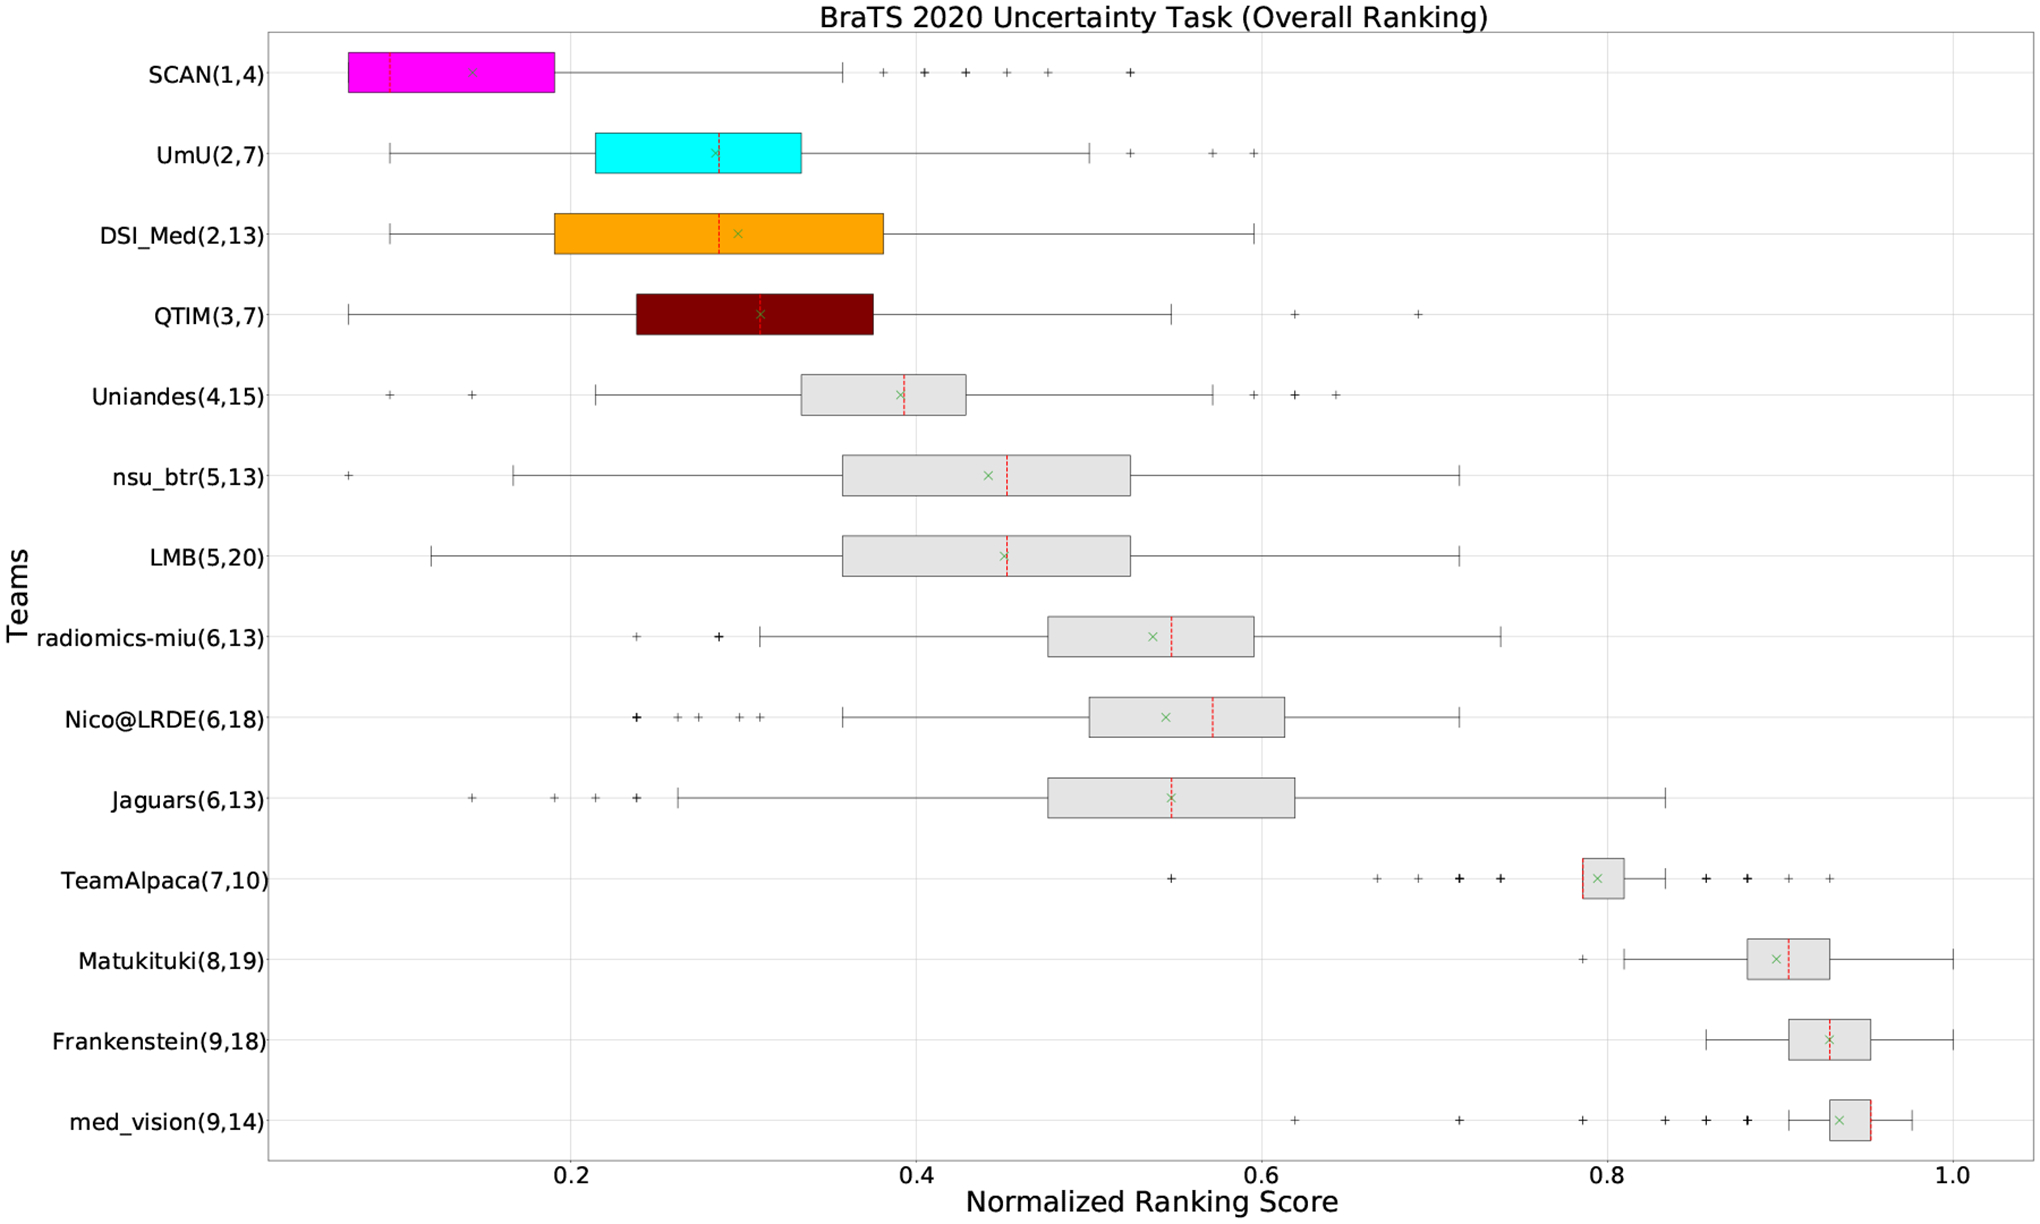
Figure 3:

QU-BraTS 2020 boxplots of Normalized Ranking Score (NRS) across patients for all participants on the BraTS 2020 test set (lower is better). Boxplots for the top four performing teams are visualized using Pink (Team SCAN), orange (Team DSI_Med), Cyan (Team UmU), and Maroon (Team QTIM) colour. Box plots for the remaining teams use gray colour. Y-axis shows the name of each team and their respective uncertainty task ranking, followed by their segmentation task ranking. There was no statistically significant difference between per patient ranking of teams ranked at the same position. Teams which has different ranks had statistically significant differences in their per-patient ranking.
