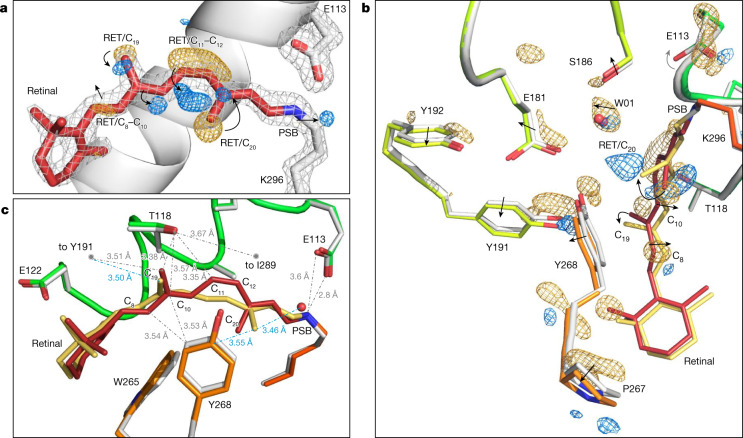
Fig. 2. Retinal conformation captured 1 ps after rhodopsin photoactivation using TR-SFX.
a, Changes in electron density. The retinal (RET) model (red) and the contoured grey mesh (at 2.7σ of the 2Fobs − Fcalc electron density map) correspond to rhodopsin in the dark state obtained by SFX. The difference Fourier electron density (Fobs(light) − Fobs(dark) contoured at 3.8σ) around the C11=C12 bond of the polyene chain and the C20 methyl show features appearing after 1 ps photoactivation in blue (positive density) that are correlated with disappearing features in gold (negative density), establishing that the chromophore has already isomerized. A negative density is also observed along C8 and C10 of the retinal polyene chain. b,c, The effect of retinal isomerization on the surrounding amino acid residues. The model of 1-ps-photoactivated rhodopsin (retinal in yellow; rhodopsin in orange and green) obtained from the extrapolated map 2Fext − Fcalc (21% photoactivation; Methods) superimposed to the dark-state model (retinal in red; rhodopsin in grey). The main chain Cɑ atoms of the protein were used for the structural superposition. b, The difference electron density map (Fobs(light) − Fobs(dark), contoured at 3.4σ) shows the presence of positive and negative electron densities (blue and yellow) around specific amino acids such as Tyr2686.51 of the binding pocket. The arrows illustrate shifts or rotations. c, The torsion of the retinal polyene chain at C11–C13 in the direction of Tyr268 (the π-system at the isomerizing bond of retinal (yellow model) is now rotated 90° with respect to that of the dark state48 (red model) (Extended Data Fig. 6)) and the bending along C6–C11. Selected distances from retinal to rhodopsin residues are shown as grey dotted lines for the dark state and as blue dotted lines for the isomerized form.

