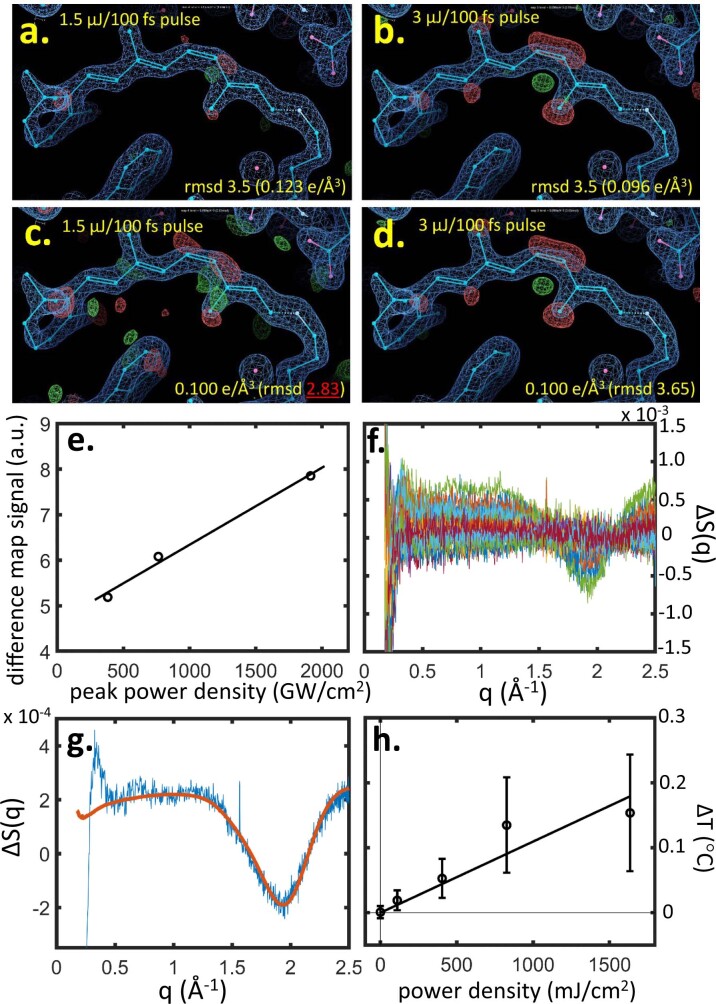
Extended Data Fig. 3. Correlation between the power density of the pump laser and either the water heating signal by time-resolved X-ray solution scattering (TR-XSS) or the rhodopsin photoproduct appearance by time-resolved serial femtosecond crystallography.
a-e.) Lowest limit of pump laser power (a-e) for observing decent difference electron density (DED) signals in rhodopsin within the present experimental settings. Two datasets of rhodopsin photoactivated for a 10 ps time delay were collected (SwissFEL beamtime 20200597) at 2 different laser powers, 1.5 (a and c) and 3 µJ/100 fs pulse (b and d) with the same focus (100 µm spot diameter (1/e2)) and same amount of 29.900 images. For both pump laser powers, the retinal isomerization and the concomitant C20-methyl rotation are observable, but the positive electron density signals are barely detectable in the case of the low power setting (a panel compared to b), e.g. the 11-cis-to-trans event is marked by a strong negative electron density on the 11-cis, but no corresponding positive density is detected. When the intensity of the DED is increased for both until an equal level of 0.100 e/Å3, we observe that the signal-to-noise ratio for the low pump laser energy condition (c panel) is so low that the signals cannot be interpreted, compared to the condition with twice the energy (d panel). Power titration including 1.5 µJ/100 fs pulse, 3 µJ/100 fs pulse (10 ps time points) and the 5 µJ/100 fs pulse (1 ps time point), with peak power density of 382 GW/cm2, 764 GW/cm2 and 1914 GW/cm2, respectively (e panel). (f-h) Time-resolved X-ray solution scattering (TR-XSS) studies of visual rhodopsin using XFEL radiation. f) TR-XSS difference data (laser on minus laser off) recorded at the LCLS from detergent solubilized samples of rhodopsin for the time-delays 10 ps ≤ Δt ≤ 1 μs at various laser power densities. g) Principal singular value decomposition (SVD) component (blue line) from samples of visual rhodopsin indicating laser induced heating (characteristic curve from 0.5 Å−1 ≤ q ≤ 2.5 Å−1) as well as oscillations usually associated with protein induced structural changes (visible from 0.25 Å−1 ≤ q ≤ 1.0 Å−1). An experimental difference X-ray scattering curve due to heating alone (red line) recorded from detergent solubilized samples of a photosynthetic reaction centre using synchrotron radiation65, is used to calibrate this laser induced heating. h) Laser induced heating in samples of visual rhodopsin measured by TR-XSS when using a 480 nm fs laser pulse with a fluence of 110 mJ/cm2 (number of independent measurements, n = 6); 400 mJ/cm2 (n = 6); 830 mJ/cm2 (n = 3); and 1640 mJ/cm2 (n = 2), where the fluence is averaged across the FWHM of the laser spot. Negative time-delays (n = 4) were used as a control (plotted at zero fluence). Data are presented as mean values +/− SEM.

