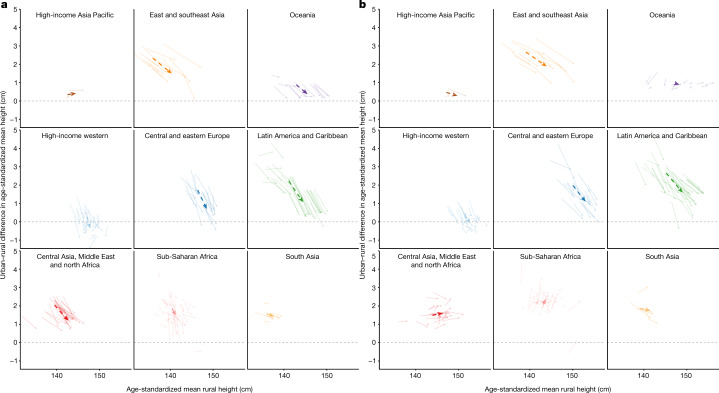
Fig. 1. Change in the urban–rural height difference from 1990 to 2020.
a,b, Change in the urban–rural difference in age-standardized mean height in relation to the change in age-standardized mean rural height in girls (a) and boys (b). Each solid arrow in lighter shade shows one country beginning in 1990 and ending in 2020. The dashed arrows in darker shade show the regional averages, calculated as the unweighted arithmetic mean of the values for all countries in each region along the horizontal and vertical axes. For the urban–rural difference, a positive number shows a higher urban mean height and a negative number shows higher rural mean height. See Extended Data Fig. 2 for urban–rural differences in age-standardized mean height and their change over time shown as maps, together with uncertainties in the estimates. See Supplementary Fig. 4a for results at ages 5, 10, 15 and 19 years. We did not estimate the difference between rural and urban height for countries classified as entirely urban (Bermuda, Kuwait, Nauru and Singapore) or entirely rural (Tokelau).

