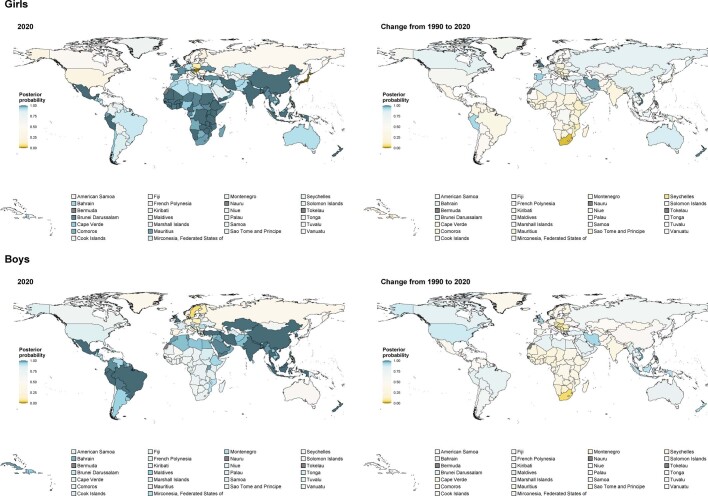
Extended Data Fig. 9. Posterior probability of urban-rural body-mass index (BMI) difference in 2020 and its increase from 1990 to 2020.
The maps show the posterior probability (PP) that age-standardised mean BMI in 2020 in urban areas was higher than in rural areas (left-hand panels), and the PP that the urban-rural difference in mean BMI increased from 1990 to 2020 (right-hand panels). We did not estimate the PP for differences between rural and urban BMI for countries classified as entirely urban (Bermuda, Kuwait, Nauru and Singapore) or entirely rural (Tokelau), as indicated in grey.

