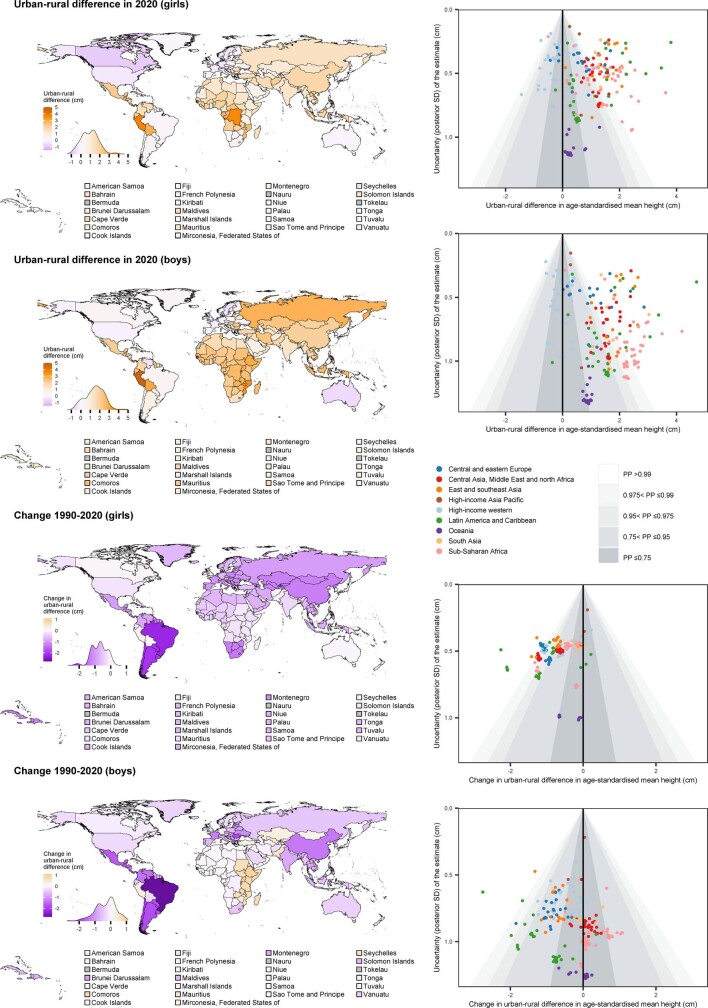
Extended Data Fig. 2. Urban-rural height difference in 2020 and change from 1990 to 2020.
The top two maps show the urban-rural difference in age-standardised mean height in 2020 for girls and boys resepectively. A positive number shows higher urban mean height and a negative number shows higher rural mean height. The bottom two maps show the change from 1990 to 2020. The density plot below each map shows the distribution of estimates across countries. The top two scatter plots show the urban-rural difference in age-standardised mean height in relation to the uncertainty of the difference measured by posterior s.d. The bottom two scatter plots show the change from 1990 to 2020 in urban-rural difference in mean height in relation to the uncertainty of the change measured by posterior s.d. Each point in the scatter plots shows one country. Shaded areas approximately show the posterior probability (PP) of a true difference (top two scatter plots) and of a true increase or decrease in difference (bottom two scatter plots). See Extended Data Fig. 8 for PPs of the urban-rural difference in age-standardised mean height and its change. See Supplementary Fig. 7 for results at ages 5, 10, 15 and 19 years. We did not estimate the difference between rural and urban height for countries classified as entirely urban (Bermuda, Kuwait, Nauru and Singapore) or entirely rural (Tokelau), as indicated in grey.

