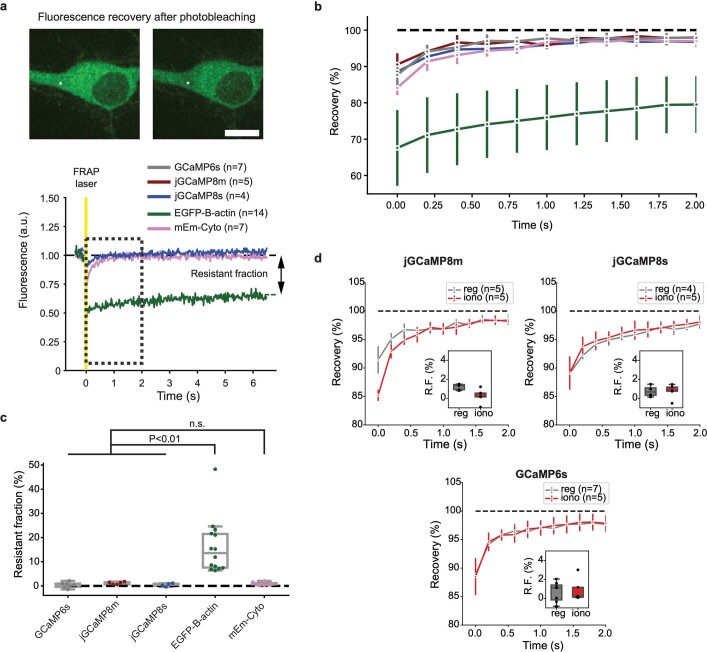
Extended Data Fig. 7. Sensor diffusion in cultured neurons studied with fluorescence recovery after photobleaching (FRAP).
a. Top, images of a representative cultured neuron expressing jGCaMP8m before (left) and immediately after (right) laser illumination. Asterisk indicates bleached region. Bottom, representative single-trial FRAP curves for jGCaMP8s (blue), cytoplasmic mEmerald (mEm-Cyto; pink) and EGFP-β-actin (green), normalized to pre-stimulation fluorescence values and aligned to the FRAP laser pulse (yellow). Boxed area denotes zoomed-in region shown in b. n values indicate number of neurons tested in each condition for subsequent panels. Scale bar, 10 µm. b. Recovery curves of all tested variants (mean ± std.dev.). For clarity, only every 10th point in the trace is plotted. The color scheme is the same as in a – this panel also shows GCaMP6s (grey) and jGCaMP8m (dark red). c. Resistant fractions. The resistant fractions of GCaMP6s (0.3 ± 1.2%), jGCaMP8m (1.3 ± 0.5%), and jGCaMP8s (0.4 ± 0.7%) were not significantly different from a cytosolic GFP marker (mEm-Cyto, 0.9 ± 0.7%), but were significantly different from actin-bound GFP (EGFP-β-actin, 16.1 ± 11.4%; Welch’s ANOVA with Dunnett’s T3 multiple comparisons test; n.s.: P > 0.45). P values: GCaMP6s vs. jGCaMP8m, 0.46; GCaMP6s vs. jGCaMP8s, >0.9999; GCaMP6s vs. mEm-Cyto, 0.95; GCaMP6s vs. EGFP.B-actin, 0.0014; jGCaMP8m vs. jGCaMP8s, 0.46; jGCaMP8m vs. mEm-Cyto, 0.86; jGCaMP8m vs. EGFP.B-actin, 0.0030; jGCaMP8s vs. mEm-Cyto, 0.97; jGCaMP8s vs. EGFP.B-actin, 0.0019; n values same as in panel a. d. Recovery curves (mean ± std.dev.) of jGCaMP8m, jGCaMP8s and GCaMP6s, without (“reg”) or with (“iono”) added ionomycin to saturate sensor with Ca2+ (Methods). n values correspond to the number of neurons tested in each condition. Insets: percent resistant fraction. Box-whisker plots indicate the median and 25th–75th percentile range; whiskers indicate the shorter of 1.5 times the inter-quartile range or the extreme data point.

