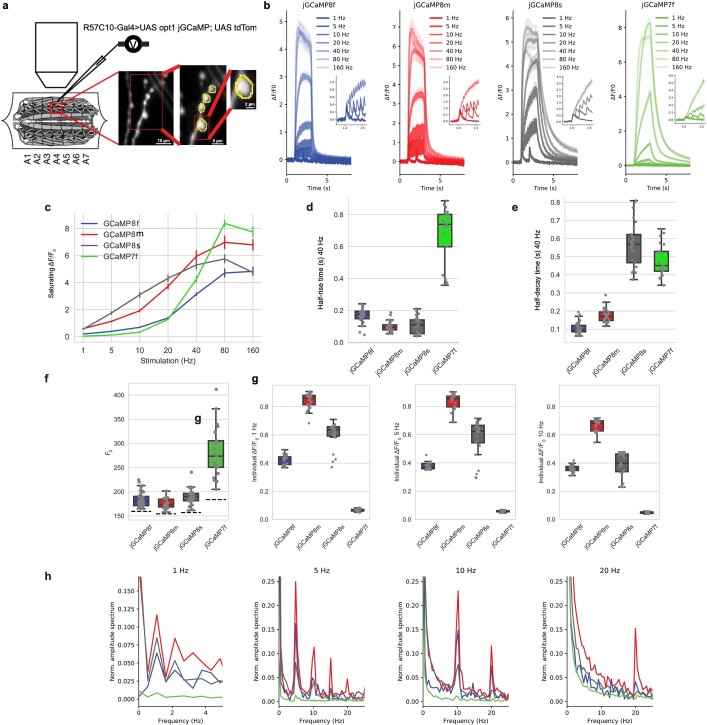
Extended Data Fig. 10. Characterization of GCaMP variants in larval neuromuscular junction (NMJ).
a. Design of larval NMJ experiments. b. Fluorescence response to 1, 5, 10, 20, 40, 80 and 160 Hz stimulation (2 s) of motor axons. Inset: zoomed response to 1, 5, 10 and 20 Hz. jGCaMP8s showed superior response from 1-20 Hz and jGCaMP7f above 80 Hz, where signals saturated. Mean ± s.e.m. shown. c. Saturating ∆F/F0 to 2 s motor axon stimulation at 1, 5, 10, 20, 40, 80 and 160 Hz. Mean ± s.e.m. shown. d. Half-rise time from stimulus onset to saturated peak under 40 Hz stimulation. Half-rise time at 40 Hz stimulation was markedly shorter than jGCaMP7f for all jGCaMP8 variants. e. Half-decay time from stimulus end to baseline under 40 Hz stimulation. Half-decay time was much shorter than jGCaMP7f for jGCaMP8f and jGCaMP8m. f. F0 for each sensor. Dash line indicates the background fluorescence level. Resting fluorescence for the jGCaMP8 variants was lower than jGCaMP7f. g. Individual responses to 1, 5, and 10 Hz stimulation. The jGCaMP8 series detect individual stimuli much better than jGCaMP7f. Box-whisker plots in d-g indicate the median and 25th–75th percentile range; whiskers indicate the shorter of 1.5 times the inter-quartile range or the extreme data point. h. Power spectral density normalized to 0 Hz for responses to 1, 5, 10, and 20 Hz stimulation. Colors as above. Power spectral analysis confirms the performance of the jGCaMP8 indicators, with jGCaMP8m performing the best at all frequencies, particularly at the high end – jGCaMP8m shows strong power at 20 Hz trains, whereas jGCaMP7f is negligible. Panels d-g: Each data point represents a single bouton. # of boutons per line are: jGCaMP8f, 27; jGCaMP8m, 25; jGCaMP8s, 25; jGCaMP7f, 21. Boutons are from five individuals per line.

