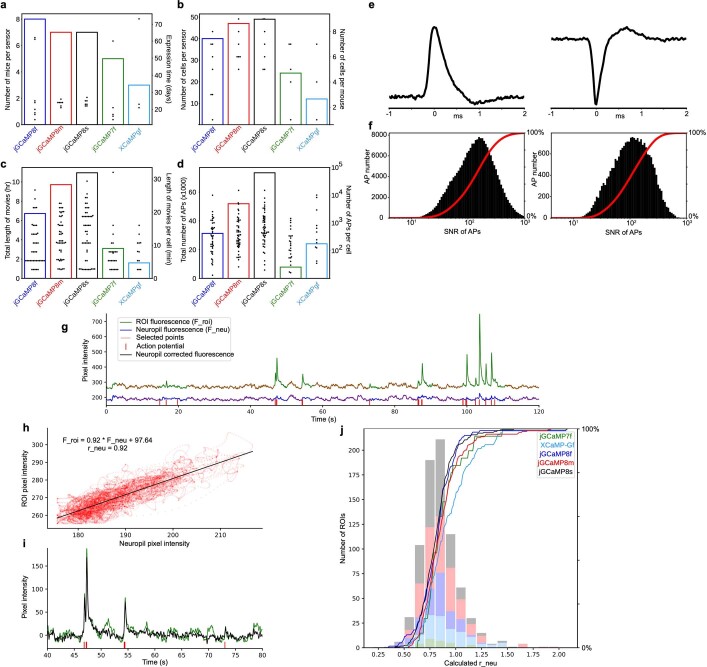
Extended Data Fig. 14. Analysis of simultaneous imaging-electrophysiology experiments.
a-d. Descriptive statistics for loose-seal cell-attached recordings. a. Summary plot showing the number of mice used (bars, left y-axis) and the expression time at the time of the loose-seal recording in days (dots, right y-axis), for each sensor. b. Summary plot showing the total number of cells recorded (bars, left y-axis), and the number of cells recorded per mouse (dots, right y-axis) for each sensor. c. Summary plot showing the total length of simultaneous imaging and loose-seal recordings in hours (bars, left y-axis), and the length of simultaneous imaging and loose-seal recordings in minutes for each cell (dots, right y-axis). d. Summary plot showing the total number of action potentials (bars, left y-axis), and the number of recorded action potentials for each cell (dots, right y-axis – log scale), for each sensor. e-f. Signal-to-noise ratio of action potential recordings. e. Representative waveforms of loose-seal recorded action potentials in current-clamp (left) and voltage-clamp (right) recording mode. f. Signal-to-noise ratio distribution for all recorded action potentials in current-clamp (left) and voltage-clamp (right) recording mode. g-j. Sensor fluorescence across cell body ROIs and neuropil. g. A representative fluorescence trace for a cellular ROI (green) and its surrounding neuropil (blue) with simultaneous loose-seal recording. For calculating the distribution of neuropil contamination coefficients (r_neu), time points during the 3 s after an electrophysiologically recorded action potential (red vertical bars) were not included. Time points included in the analysis are highlighted in red. Note the correlation between cellular and neuropil ROI. Traces were high-pass filtered using a 10-second-long minimum filter and low-pass filtered with a Gaussian filter (σ = 10 ms). h. Cellular ROI pixel intensity values plotted against their corresponding neuropil pixel intensity values (time points highlighted with red in panel g), and their linear fit. The neuropil contamination coefficient is defined as the slope of this fitted function. i. Raw and neuropil corrected trace from panel g (40-80 sec), corrected with the neuropil contamination coefficient calculated in panel h (F_corr = F_roi - r_neu*F_neu). j. Distribution of r_neu values, each calculated on 3-minute-long simultaneous optical and electrophysiological recordings as shown in panels g-h. We included r_neu values only with a Pearson’s correlation coefficient > 0.7. Colors represent different GECIs. Calculated values of r_neu were similar between GECIs except for XCaMP-Gf, which was quite dim.

