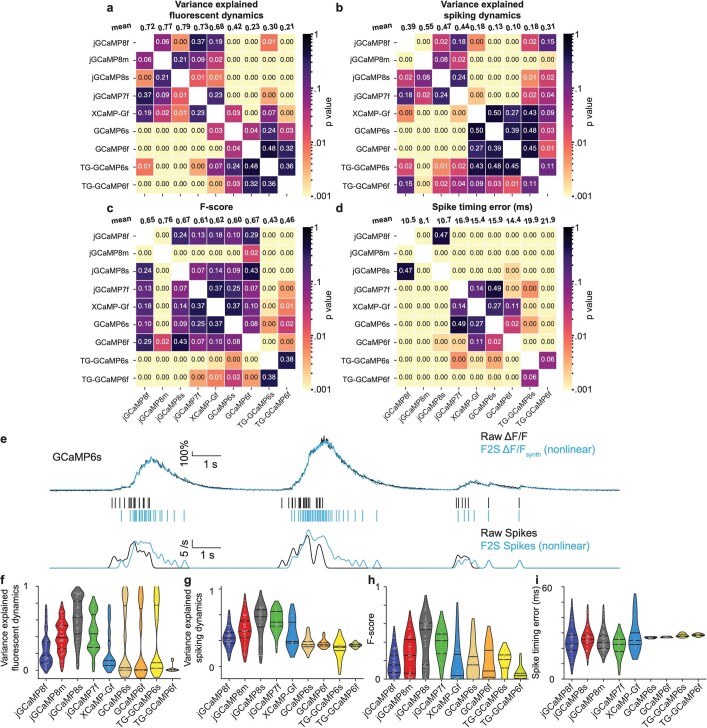
Extended Data Fig. 19. Statistics of F2S fits.
a-d. Pairwise comparisons of F2S performance under different imaging conditions. Pairwise comparisons (two-sample rank-sum tests; two-sided) of indicators in each performance measure in Fig. 5e–h. The heatmap presents the significance, i.e., p-value. The top row (mean) shows the statistics of the average. a. Fluorescence dynamics (fits compared to raw fluorescence); b. Spiking (fits compared to ground-truth spiking dynamics); c. F-score (spike detectability) using a linear F2S model; d. Spike-timing error using a linear F2S model. e-i. Statistics of F2S fits using a nonlinear model. e. Example trace and fit of a cell using a nonlinear F2S model – using the same conventions as Fig. 5d-bottom. Top, variance explained of fluorescence dynamics, 93%; bottom, variance explained of spiking, 13%. f-g. Performance of fitting activity profiles. Violin plots, lines from top to bottom: 75%, 50%, 25% of data, respectively. f. Fluorescence dynamics; g. Spiking. h. Spike detectability. i. Spike-timing error.

