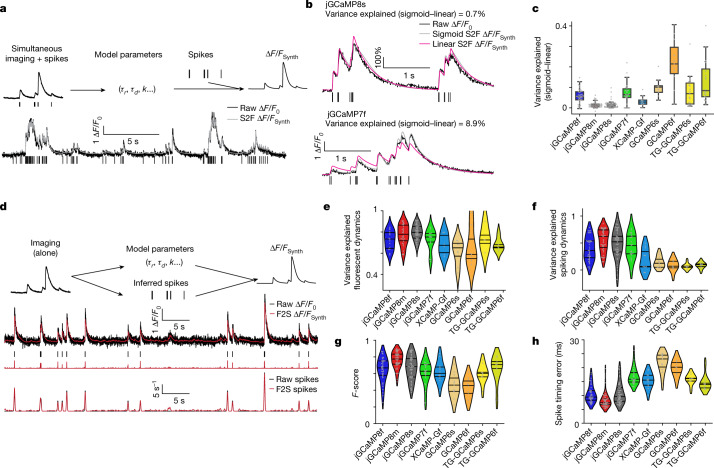
Fig. 5. Spike-to-fluorescence and fluorescence-to-spike models.
a, Spike-to-fluorescence (S2F) model. Schematic plot of the S2F forward model that generates a synthetic fluorescence trace (∆F/FSynth) from an input spike train (top), and an example fit and data for one cell (bottom) are shown. Measured ∆F/F0 (black) is overlaid with the simulated ∆F/FSynth (grey) from the S2F model. The input to the model, the simultaneously recorded spikes (black), are shown below the traces. b, Exemplary cell dynamics with different degrees of non-linearities. c, The degree of non-linearity (measured by the difference of variance explained using a sigmoid fit from that using a linear fit). Non-linearity is low for jGCaMP8 sensors (see Extended Data Table 5 for more details) but high for GCaMP6 sensors (TG: GCaMP6 transgenic mouse; otherwise, AAV application). The minima indicate 0th percentile of data (0%); the maxima denote 100%; the centre line indicates 50%; the bounds of box are from 25% (lower quartile) to 75% (upper quartile); and the whiskers indicate 1.5 times the distance between the upper and lower quartiles. The number of biologically independent cells collected in each condition is shown in Extended Data Table 5. d, Fluorescence-to-spike (F2S) model. Schematic plot of the F2S inference model that generates a synthetic fluorescence trace (∆F/FSynth) from an inferred spike train (top), and an example fit and data of a cell (bottom) are shown. The first row shows experimental spikes and the measured ∆F/F0 overlaid with the simulated ∆F/FSynth from the F2S model. The second row shows the simultaneously recorded ground-truth spikes (black), shown below the traces, compared with the inferred spikes (red). The third row shows the recorded spike rate overlaid with the inferred spike rate from the F2S model. e–h, Violin plots, lines from top to bottom: 75%, 50%, 25% of data, respectively. e,f, Performance of fitting activity using the linear F2S model. Fluorescence dynamics (fits compared with raw fluorescence) (e) and spiking (fits compared with ground-truth spiking dynamics) (f) are shown. g, Performance of spike detectability using the linear F2S model. h, Spike-timing error using the linear F2S model.

