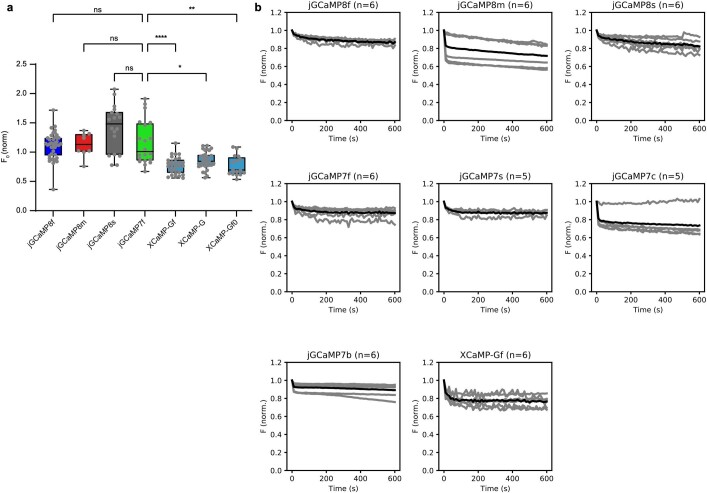
Extended Data Fig. 4. Baseline brightness and photobleaching of sensors.
a. Baseline brightness. The jGCaMP8 series exhibited similar baseline fluorescence in the cultured neuron assay compared to jGCaMP7f, but XCaMP sensors were significantly dimmer (H(6) = 71.77, P < 0.0001, Kruskal-Wallis test; Dunn’s multiple comparisons test with jGCaMP7f as control). n.s.: not significant (P > 0.99). *P = 0.012; **P = 0.0012; ****P < 0.0001. Each point represents median neuronal brightness from a single well. jGCaMP8f: n = 40, jGCaMP8m: n = 8, jGCaMP8s: n = 18, jGCaMP7f: n = 20, XCaMP-Gf: n = 29, XCaMP-G: n = 31, XCaMP-Gf0: n = 16; overall statistics: n = 2 independent transfections, 5 96-well plates. Box-whisker plots indicate the median and 25th–75th percentile range; whiskers indicate the shorter of 1.5 times the inter-quartile range or the extreme data point. b. Photobleaching of jGCaMP8, jGCaMP7, and XCaMP variants in neuron cell culture. Grey lines: individual cells, black lines: mean. Each cell’s fluorescence trace was normalized to the initial value. N values indicate number of cells (n = 1 well per variant, n = 1 transfection day). After continuous illumination for 10 min, neurons transfected with jGCaMP8 variants lost on average 13-28% of their initial fluorescence. jGCaMP8m exhibited biphasic bleaching: a rapid phase consisting of ~15% fluorescence loss within 10 s followed by a slower phase (10% within 10 min). Of the other variants, jGCaMP7c also exhibited this property. We noticed considerable variability in the photobleaching rates within individual neurons, possibly stemming from expression level and differences in baseline brightness in each neuron as a function of intracellular resting [Ca2+].

