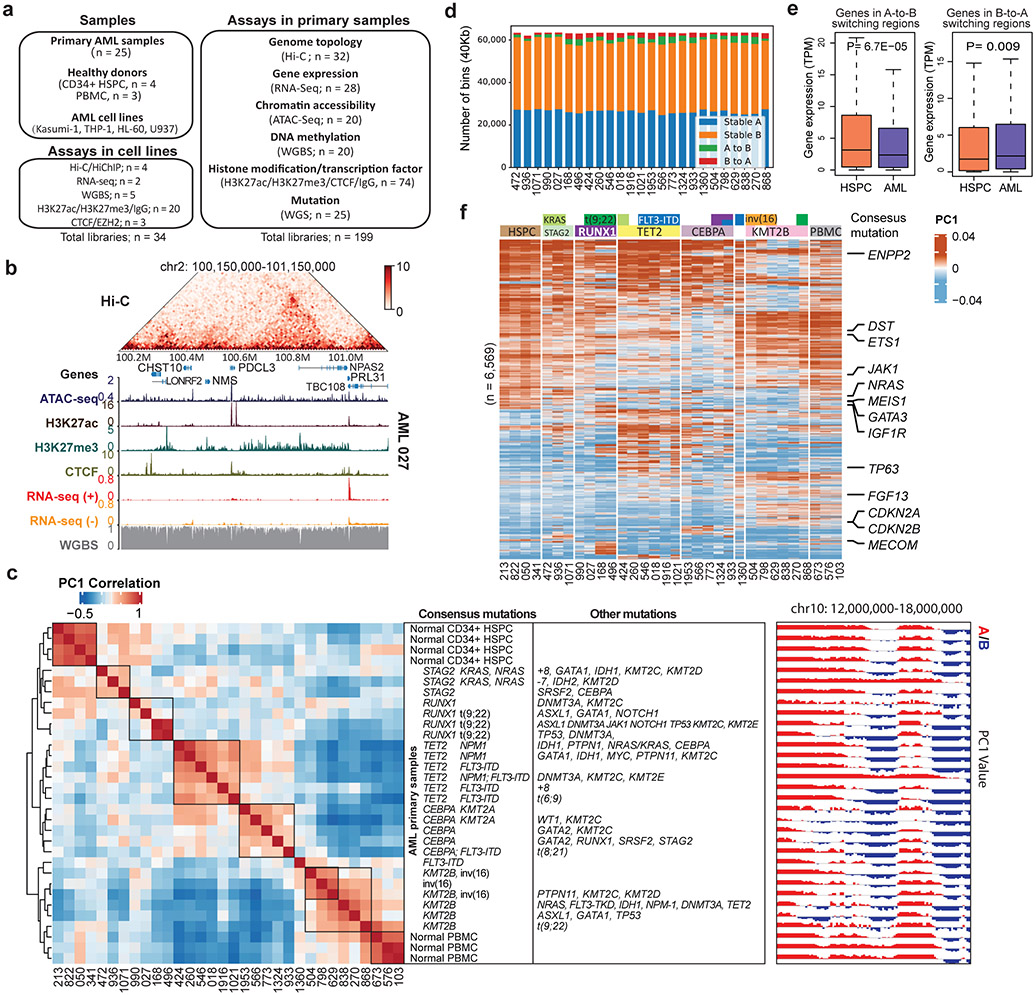
Figure 1 ∣. Genome organization and compartment analysis in primary AML samples.
a, Summary of the AML samples and the genomic profiling assays performed in this study. b, Snapshot of an example region, showing Hi-C, ATAC-Seq, RNA-Seq, WGBS, and CUT&Tag for H3K27ac, H3K27me3 and CTCF data in the same patient (AML 027). The values for y-axis for ATAC-seq and CUT&Tag and the Hi-C data were normalized to sequencing depths. c, Left, unsupervised hierarchical clustering of AML and control samples based on the top 10% most variable first principal component (PC1) of the Hi-C matrices. Middle, mutation profiles of the known AML-relevant genes. Consensus mutations were not pre-selected but summarized from the clustering result. Right, an example region showing PC1 values and A/B compartment variations across samples. Squares on the heatmap demarcate samples with similar mutations. d, Number and proportion of A/B compartment switch in each AML sample, compared with HSPC. e, Gene expression alteration associated with change of A/B compartment. n=1,724 genes for A-to-B and n=867 for B-to-A. Genes are located inside recurrent compartment switch regions (in at least two AML samples). P value by two-sided Wilcoxon rank-sum test. Box plot: middle line denotes median, top/bottom of boxes denotes first/third quartiles and whiskers extend to 1.5 times the interquartile range of the first and third quartile. f, Clustering analysis of genomic regions (40kb bins) with differential Hi-C PC1 values, selected by one-way ANOVA analysis with P < 0.05. Samples were grouped by the gene mutation patterns. Representative COSMIC cancer census and AML-related genes in the corresponding regions are marked on the right.

