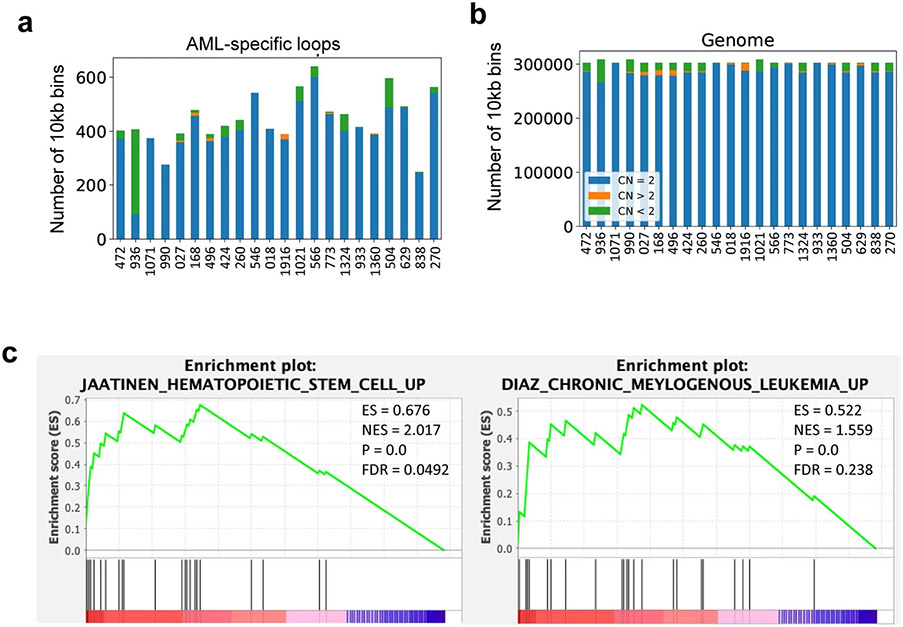
Extended Data Fig. 4. AML-specific loop analysis.
a, Overlap of AML-specific loops with CNVs. Color scheme: neutral (blue), gain (orange), or loss (green) of copies. b, Genome-wide CNV profiles for all the 10kb bins. c, GSEA analysis for differentially expressed genes associated with AML-specific loops. P value is calculated by permutation test.

