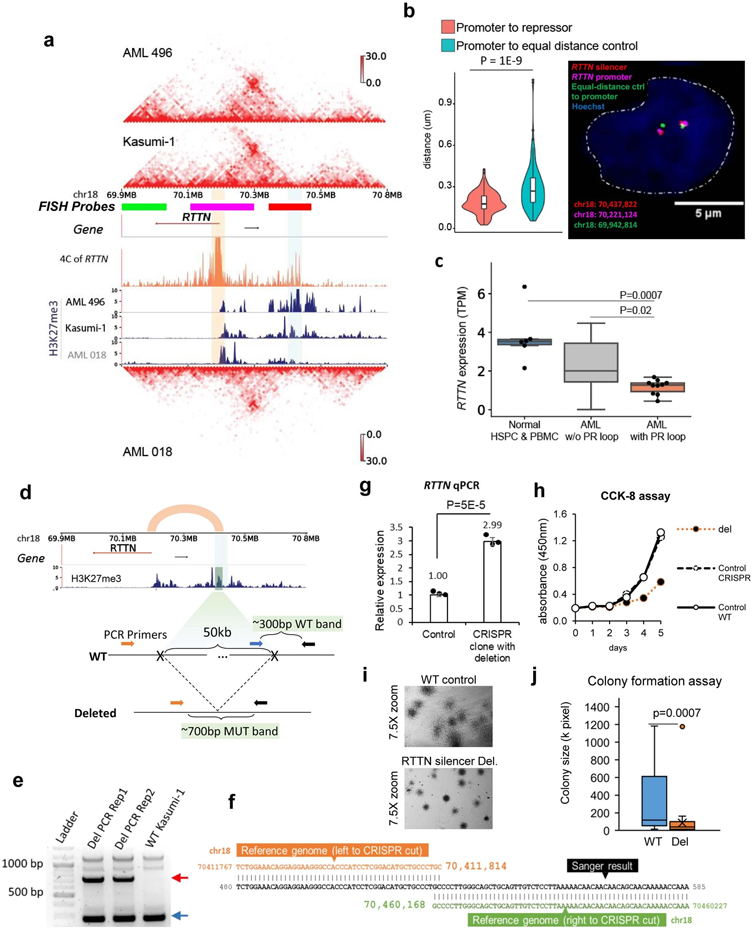
Extended Data Fig. 7. Validation of a P-S loop for the RTTN gene.

a, Hi-C and H3K27me3 CUT&Tag data in AML patient sample 496 and Kasumi-1 cells, which have the P-S loop for RTTN. AML sample 018 has the same loop but with less interacting signals and almost no H3K27me3 signals at the loop anchor. The orange tracks are the 4C data for RTTN in Kasumi-1 cells. b, (Right) DNA FISH imaging to measure the distance between RTTN promoters and the looped silencers in THP-1 cells. The control is the region on the other side of the RTTN promoter, with equal linear genomic distance. (Left) distance distribution between promoter and control or its looped silencer from 144 THP-1 cells (P value = 1E-9, two-sided Wilcoxon rank-sum test). Box plot: middle line denotes the median, top/bottom of boxes denotes first/third quartiles and whiskers extend to 1.5 times the interquartile range. c, RNA expression of RTTN across patient samples and normal controls. Normal HSPC&PBMC n=6 samples, AML w/o P-S loop n=13, AML with P-S loop n=10. P value was computed by the two-sided Student’s t-test. Box plot: middle line denotes the median, top/bottom of boxes denotes first/third quartiles and whiskers extend to 1.5 times the interquartile range. d, The design of PCR for detecting CRISPR deletion of the RTTN silencer (vertical bar in the H3K27me3 track). e, Two replicates of PCR results confirming the heterozygous deletion of the RTTN silencer. The red arrow points to the amplification of the CRISPR deletion junction (~700bp), and the blue arrow points to the wildtype band (~300bp). f. Sanger sequencing confirmed the CRISPR deletion of the silencer. g, qPCR results of RTTN expression in the clone with this heterozygous deletion vs. control group. The control group is other clones that underwent the same CRISPR system treatment without deletion (n=3 technical replicates in 2 biological replicates). P value by two-sided Student’s t-test. Data show mean ± s.e.m. h, CCK-8 assay results for proliferation of Kasumi-1 cells with the RTTN silencer deleted vs. both the wildtype and the CRISPR control cells in panel g (n=3 biological replicates). i, Stereomicroscope images of CFA cells on day 12 at 7.5X zoom. CFA was performed in n=3 replicates. j, Size (pixel) distribution of WT colonies (n=40) and the colonies with RTTN silencer deleted (n=35), measured by imageJ. P value calculated by two-sided Wilcoxon rank-sum test. Box plot: middle line denotes the median, top/bottom of boxes denotes first/third quartiles and whiskers extend to 1.5 times the interquartile range.
