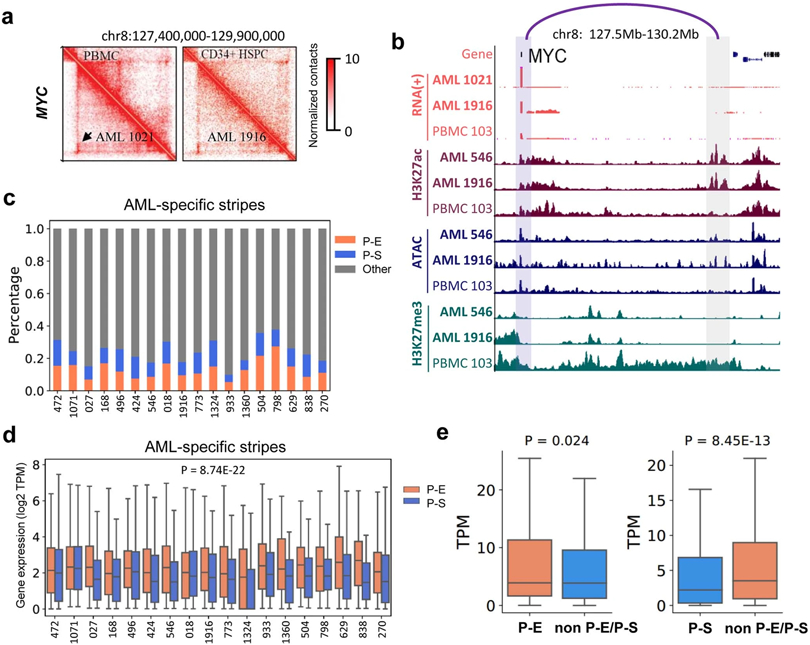
Extended Data Fig. 8. Analysis of chromatin stripes.

a, Hi-C maps for the MYC gene regions. Left lower panels are for AML samples and the right upper panels are for HSPC and PBMC. Black arrow marks a stripe. b, RNA-Seq, CUT&Tag for H3K27ac and H3K27me3, and ATAC-Seq data for regions surrounding the MYC genes. c, Classification of stripes based on whether the anchors contain gene promoters and the stripe zones contain enhancers (H3K27ac) or silencer marks (H3K27me3). d, In each patient samples, genes in enhancer stripes have higher expression than genes in silencer stripes. P-value by two-sided Kruskal–Wallis test. P-E stripes n=4310, P-S stripes n=2518. Box plot: middle line denotes the median, top/bottom of boxes denotes first/third quartiles and whiskers extend to 1.5 times the interquartile range. e. For each gene involved with a P-E stripe, samples were grouped into two categories: samples with P-E stripe, and samples with neither P-E nor P-S stripe for this gene. So was for P-S stripe analysis. Then the average gene expression (TPM) within each category was calculated. P value by two-sided Kruskal-Wallis test. Left: n=461 genes; Right: n=415 genes. Box plot: middle line denotes the median, top/bottom of boxes denotes first/third quartiles and whiskers extend to 1.5 times the interquartile range.
