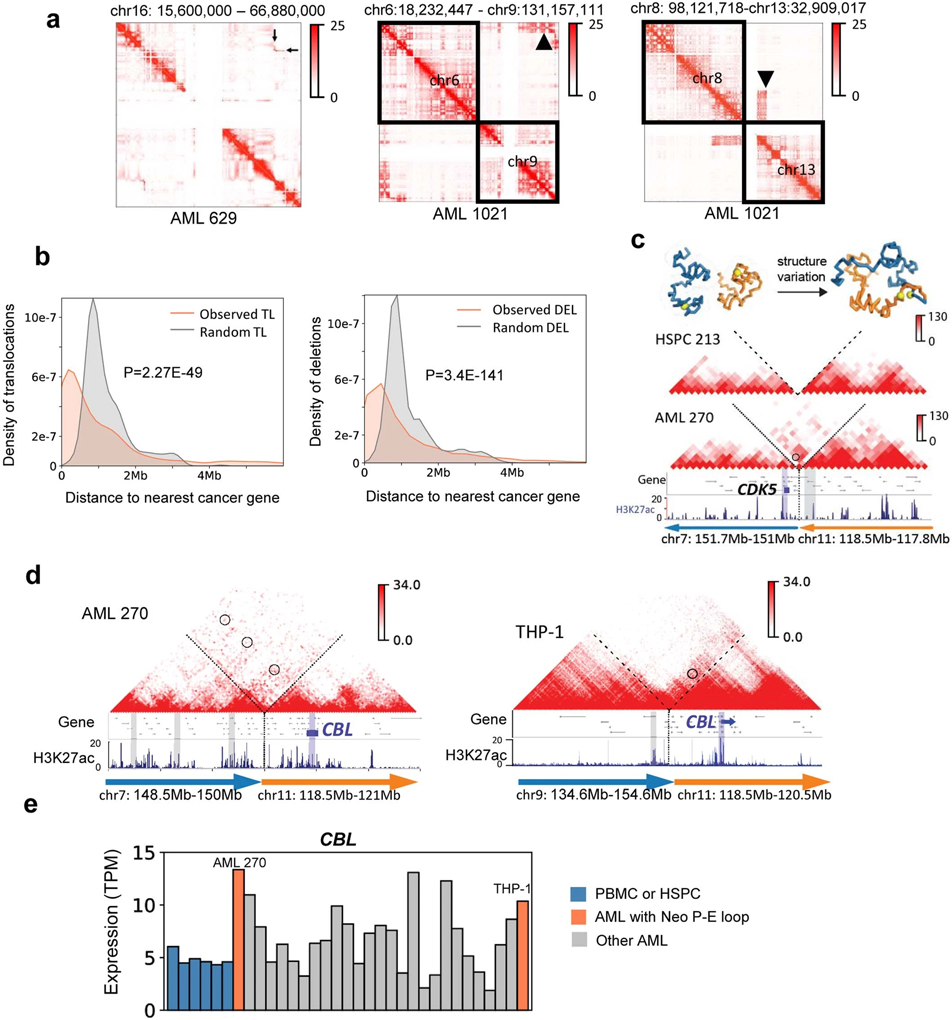
Extended Data Fig. 9. Detection and analysis of SV-induced neo-loops.

a, Detection of SVs in AML samples from Hi-C data, marked by the black arrow in Hi-C maps. Left: inv(16). Middle: t(6;9). Right: t(8;13). b, Distribution of genomic distances between translocations/deletions to the nearest cancer-related genes (COSMIC database). Expected value is calculated by random permutation of the SVs in the genome for 1000 times. P value is calculated by two sample Kolmogorov-Smirnov test. TL: translocation. DEL: deletion. c, An example of reconstructed Hi-C maps surrounding the SV breakpoint between chr7 and chr11 in the AML sample 270. We also showed the inter-chromosomal Hi-C map in the HSPC 213, where there is no visible inter-chromosomal interactions. The orientation of the SV is marked by the arrows, which always point from 5’ to 3’. The neo-loop for CDK5 is circled. Above the Hi-C: predicted 3D structure for the region in normal and AML sample visualized by PyMOL. d, Recurrent enhancer hijacking involving the CBL gene and enhancers. e, RNA expression of the CBL gene in all samples.
