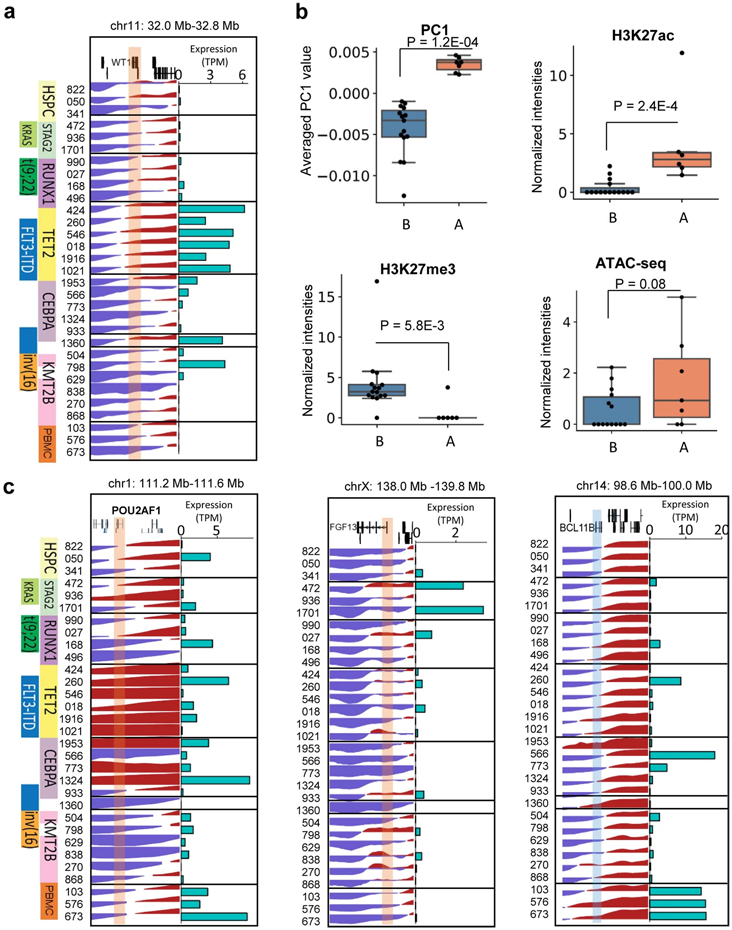
Extended Data Fig. 2. Examples of genes with A/B compartment switch.

a and c, PC1 values and the expressions for WT1, POU2AF1, FGF13, and BCL11B genes. b, A compartment associated with higher H3K27ac and ATAC-seq signals and lower H3K27me3 intensities. Shown in figure are the ATAC-seq, CUT&Tag for H3K27ac and H3K27me3 signals at WT1 gene promoter, normalized to sequencing depths. Promoter is defined as within +/−1Kb of TSS. P value by two-sided Wilcoxon rank-sum test. PC1: A (n=15 samples) B (n=7 samples); H3K27ac: A (n=15) B (n=6); H3K27me3: A (n=15) B (n=6); ATAC-seq: A (n=14) B (n=7). Box plot: middle line denotes the median, top/bottom of boxes denotes first/third quartiles and whiskers extend to 1.5 times the interquartile range.
