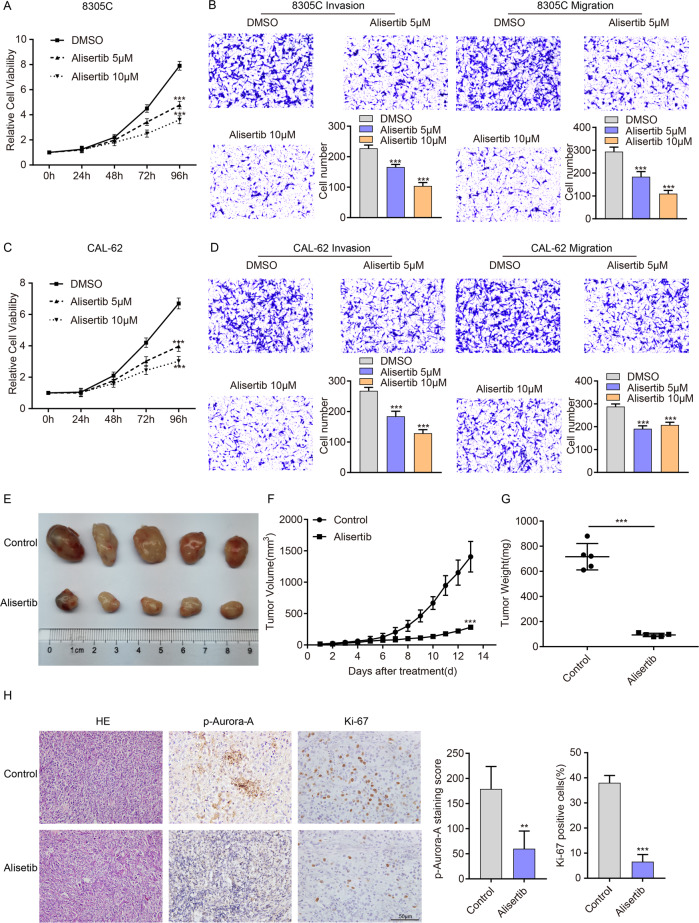
Fig. 1. Alisertib inhibits the proliferation, migration, and invasion of ATC cells in vitro and vivo.
A, C CCK-8 assays showed that Alisertib (5 μmol and 10 μmol) treatment significantly suppressed cell proliferation in 8305 C (A) and CAL-62 (C) cells in a dose-dependent pattern. B, D After treatment with the indicated concentration of Alisertib for 2 days, the migration/invasion assay was performed in 8305 C (B) and CAL-62 (D) cells. Representative images are shown. The above data are presented as the mean ± SD of three independent experiments. E Five representative tumors from NSG mice injected with CAL-62 are shown, n = 5 mice per group. The subcutaneous xenografts were dissected and are shown on day 13. F, G Tumor volumes were measured with growth curves (F) and tumor weights (G) in the control group (DMSO) and Alisertib group (30 mg/kg). H Representative IHC images and p-Aurora-A and Ki-67 staining in xenograft tumor specimens of control and Alisertib groups are shown. p-Aurora-A and Ki-67 expression were significantly decreased after treatment with Alisertib. Scale bars, 50 μm. The data are presented as the mean ± SD. All *P < 0.05, **P < 0.01, ***P < 0.001, compared with the control group.

