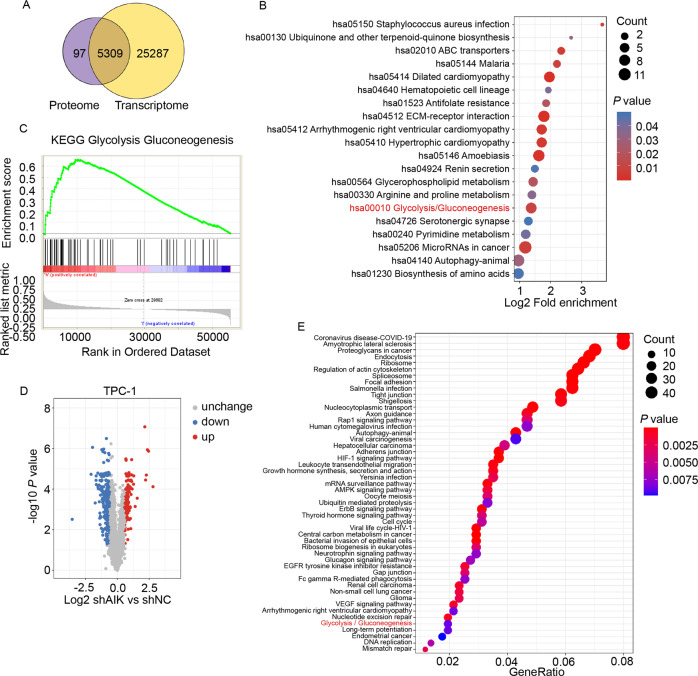
Fig. 3. Multiomics and bioinformatics analyses indicated Aurora-A regulates the glycolysis in TC cells.
A The Venn plot of proteome and RNA-seq revealed 5309 genes had significant alterations at the mRNA and protein levels after Aurora-A knockdown. B KEGG analysis of 5309 genes showed significant alterations in both proteome and RNA-seq. Glycolysis pathway can be remarkably enriched. C Analysis of TCGA database revealed Aurora-A was positively correlated with the glycolysis pathway. D Volcano plot highlighting phosphorylation changes of proteins. 318 proteins with 423 sites were identified with greater than 1.5-fold change in Aurora-A knockdown relative to control TPC-1 cells and plotted in red (upregulation) or blue (downregulation), respectively. E KEGG analysis of the phosphorylation-changed proteins after Aurora-A knockdown in TPC-1 cells. The glycolysis pathway was significantly enriched.

