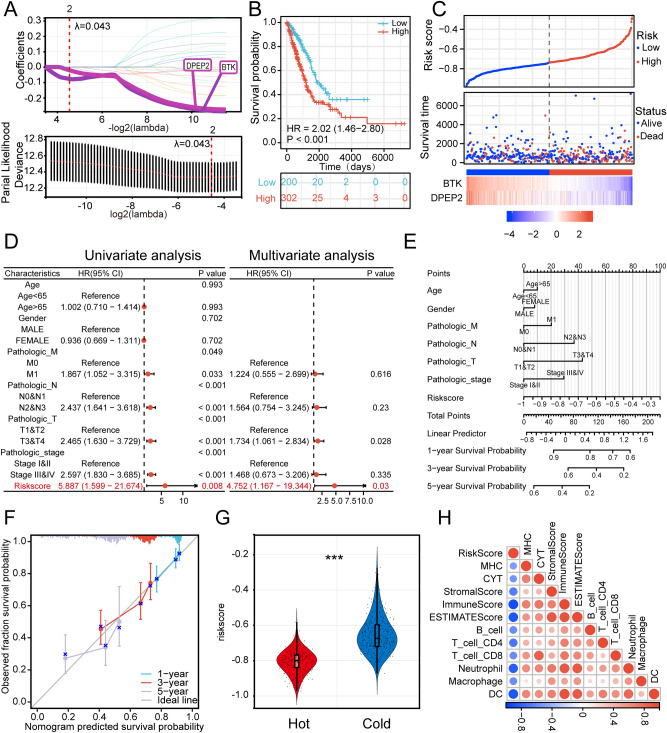
Figure 3.
The risk signature is associated with immunophenotypes (A) Screened out BTK and DPEP2 and constructed risk model by LASSO analysis with optimal lambda values (B) K-M survival analysis of patients in high- and low-risk groups. (C) The LUAD patients’ risk score distribution and survival status distribution. (D) Univariate and multivariate Cox regression analyses of the association between the prognosis of patients and different clinical-pathological factors(After exclusion of missing values, a total of 336 patients were included in the analysis). (E) Construction of a nomogram. (F) The construction of the calibration curve for the nomogram model, including three colored lines (blue, red, and purple) represent the performance of the nomogram. A closer fit to the diagonal gray line indicates a better estimation. (G) Distribution of risk score in two immune subtypes of LUAD patients. (H) Correlation of risk score with patients' immune status using different immune scoring approaches to assess risk score (***p < 0.001; **p < 0.01; *p < 0.05).

