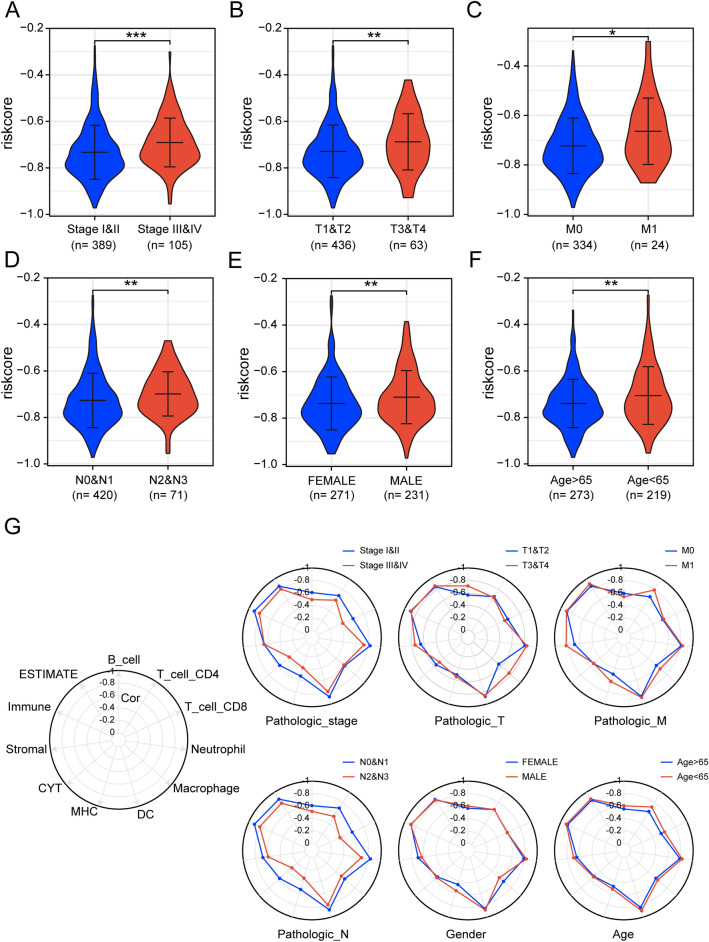
Figure 5.
Differences in risk scores in patients with different clinical features. (A–F) Distribution of risk scores in patients with LUAD at different clinical features. (G) Radar plot showing the correlation of risk scores with immune activity in patients with different clinical characteristic attributes, with the innermost circle correlation coefficient being 0 and the outermost circle correlation coefficient being -1. (***p < 0.001; **p < 0.01; *p < 0.05).

