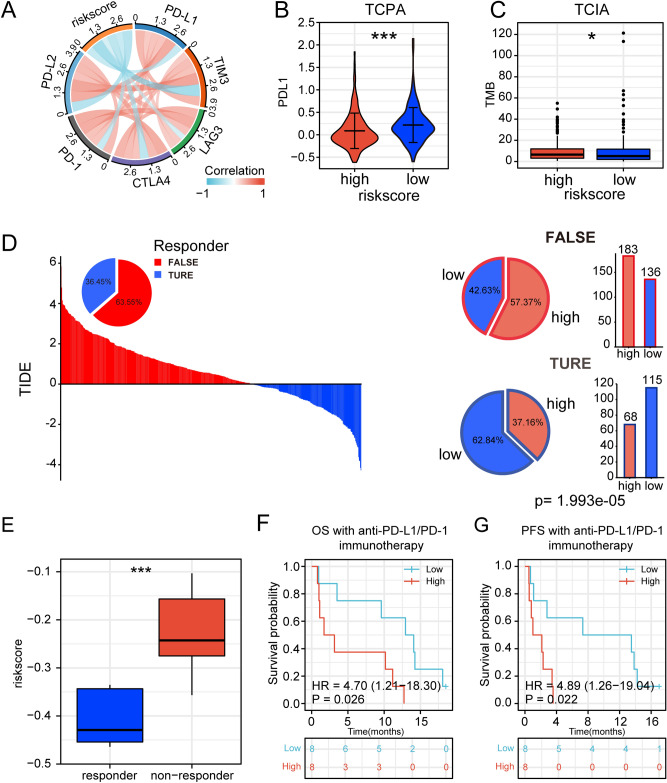
Figure 6.
Relationship between risk signature and immunotherapy. (A) Correlation between risk scores and immune checkpoints. (B) Distribution of PD-L1 protein levels in high-risk and low-risk populations based on the TCPA dataset. (C) Distribution of TMB in high- and low-risk populations based on TCIA. (D) TIDE scores and response outcomes of immunotherapy in LUAD patients. Distribution of risk scores among TIDE predicted immunotherapy response or non-response groups, chi-square. p < 0.001. (E) Distribution of risk scores among immunotherapy responders and non-responders. (F, G) Association of risk score with OS and PFS in patients receiving immunotherapy (ns: no significant difference. (***p < 0.001; **p < 0.01; *p < 0.05).

