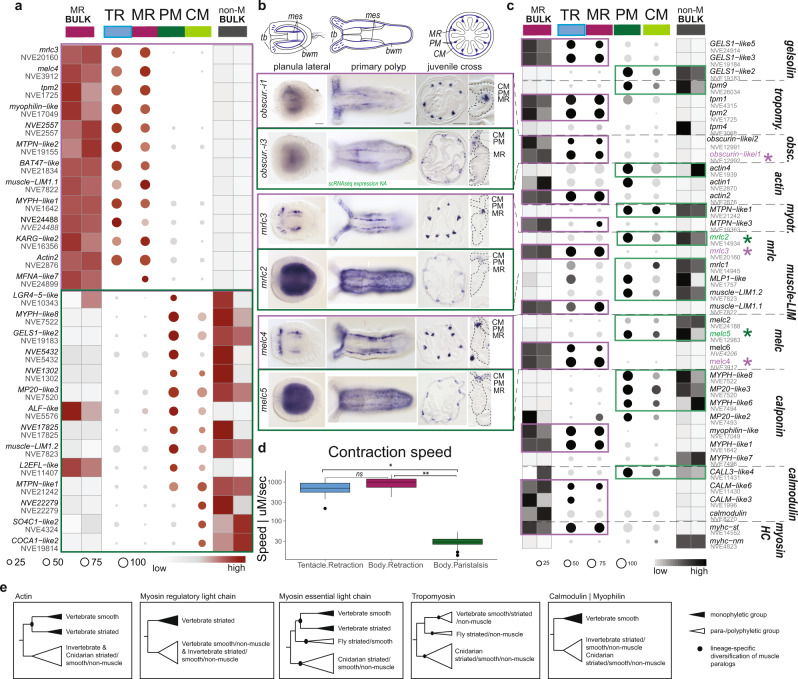
Fig. 2. Structural protein gene expression reveals two functional classes of muscle cells.
a Dot plot showing expression profiles for the 10 most significant differentially expressed genes for each muscle cluster. Cluster identity is indicated by the same coloration shown in (Fig. 1b, e). The relative expression profile of the same gene set within the bulk dataset of the non-muscle cells (non-M BULK) and the muscle cells (MR BULK) are illustrated as square blocks. Common gene sets that unite the retractor muscle (TR and MR) and the bodywall musculature (PR and CM) are boxed in purple and green, respectively. CM: circular muscle; MR: mesentery retractor; PM: parietal muscle; tentacle retractor: TR. b Validation of paralogous muscle gene sets by in situ hybridization. Schematic (top) and in situ hybridization for genes specific to the retractor muscles (purple boxes) or bodywall muscles (green boxes) are shown. One labeled mesentery is shown for each gene, and scRNA expression profiles are indicated in (c). bwm: bodywall muscle (PM & CM); mes: mesenteries; tb: tentacle buds. The oral pole is to the left in all whole mount images. Scale bars are 50 µm. c Expression profile of paralogous genes illustrating differential use across clusters, set-up as in (a). Fast (purple boxes) and slow (green boxes) paralogs are highlighted. Genes shown in (b) are indicated with an asterisk (*). d Measured contraction speeds for tentacle and body column retraction (blue and red) versus peristaltic bodywall contractions (green). Data are presented as a boxplot of log10 values of measured contraction speeds, illustrating the median, first, and third quartiles, with whiskers indicating the 95% percentile of the data. “*” denotes p-value < 0.001 in paired two-sample Student’s t-test (6e-27 and 3e-30), ns = nonsignificant (p = 0.078); n = 17 (body column retraction), 18 (tentacle retraction), and 51 (peristaltic contractions) independent measurement observations. See Supplementary Data 2—t-test for the full output of the statistical test. e Schematic overview of reconstructed gene family relationships is shown for select muscle proteins. Diversification of these protein families occurred independently in vertebrates and cnidarians. See Supplementary Fig. 6 for full-resolution trees.

