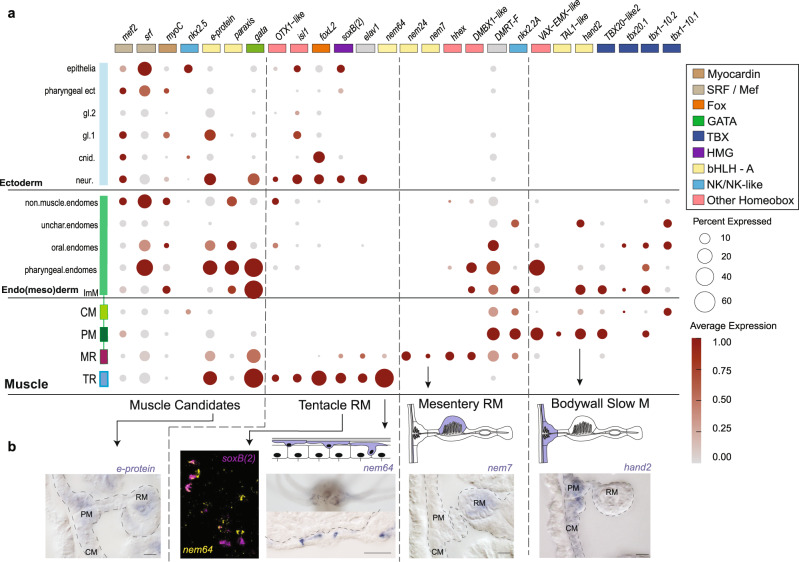
Fig. 3. Regulatory profiles of muscle cells indicate bHLH complex as key to cell type individuation.
a Dot plot showing relative expression profiles of selected regulatory genes across the entire dataset. Ectodermal derivatives are indicated in blue. Gene family relationships are indicated according to the color scheme shown in the legend. Gene sets are organized according to expression profile (Muscle Candidates, Tentacle RM, Mesentery RM, Bodywall Slow M). The relative positions of the muscle cells are shown schematically below the dot plot. b Validation of selected profiles by in situ hybridization. Scale bars are 20 µm.

