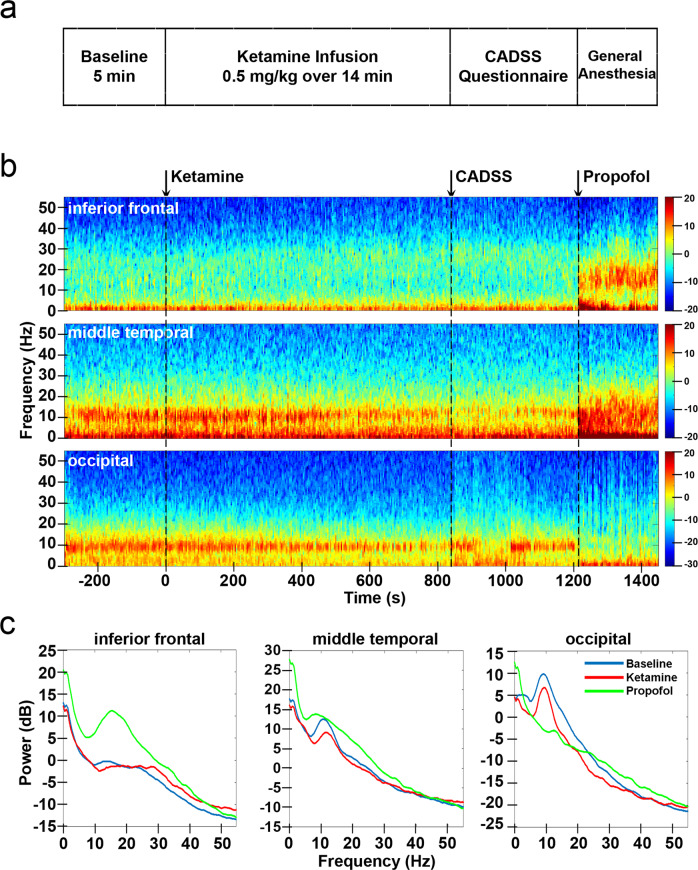
Fig. 1. Study protocol and intracranial EEG power changes for example channels.
a Study protocol. b Power spectrogram (dB) for three example channels: inferior frontal, middle temporal and occipital from Subject #9. c Power spectrum averaged across time during baseline, ketamine, and propofol conditions for the three example channels. CADSS: clinician-administered dissociative states scale. Source data are provided as a Source Data file Fig. 1.

