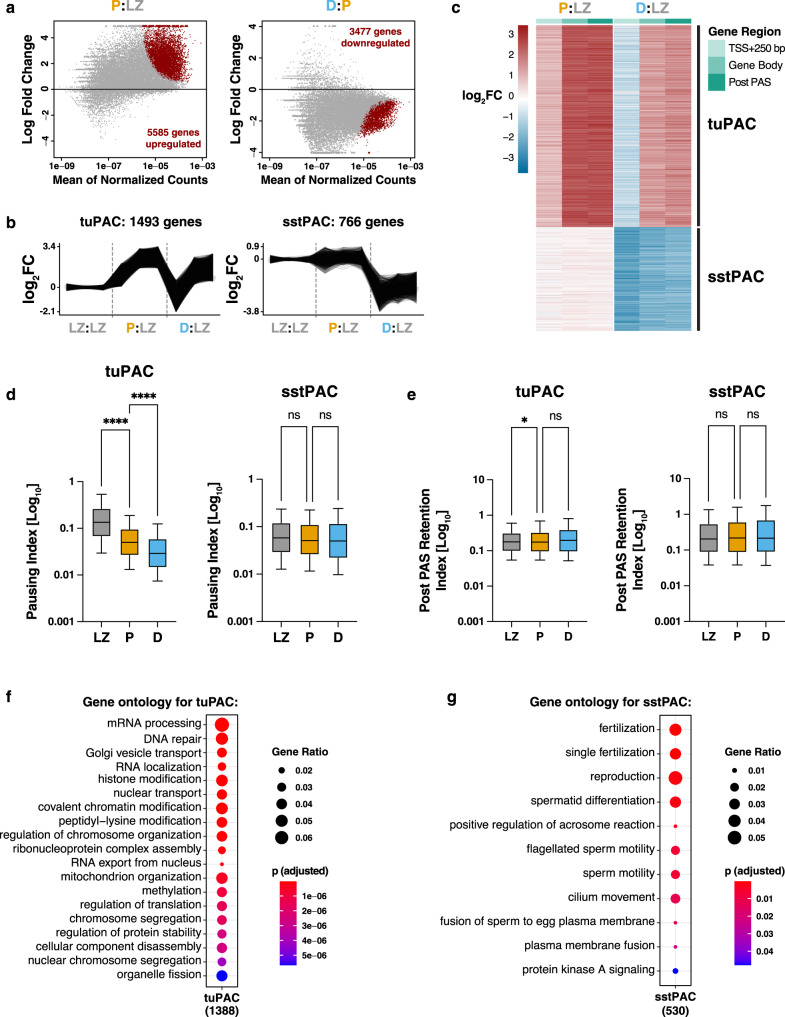
Fig. 3. Transcriptional changes between prophase I substages.
a MA plots showing the DEseq2-based differential expression analysis of leChRO-seq read counts within the gene bodies of all annotated genes comparing leptonema/zygonema and pachynema (left) and pachynema and diplonema (right). Differentially expressed genes are shaded in red on the MA plot. b Trajectories of leChRO-seq read density for individual differentially expressed genes for tuPAC (top) and sstPAC (bottom) identified in (c). c Heatmap of log2-transformed fold changes of nascent RNA transcripts enriched or depleted in the selected gene regions for all differentially expressed genes in prophase I identified with DESeq2. Genes were ranked according to changes in leChRO-seq read densities at the TSS + 250 bp, gene body, and post PAS between prophase I substages. Read counts for pachynema (P) and diplonema (D) were normalized to the read counts for leptonema/zygonema (LZ). d Box and whisker plots of pause index values calculated from the ratio of pause peak density to gene body density of leChRO-seq reads for clusters tuPAC and sstPAC. ****p < 0.0001, two-sided Wilcoxon matched-pairs signed rank test. Median value is indicated by the horizontal, center black line. The first and third quartile are indicated by the minima and maxima of the boxplot. Whiskers represent 10–90 percentile. n = 4 biologically independent samples. Source data are provided as a Source data file. e Box and whisker plots of post PAS retention index calculated from the ratio of the leChRO-seq density in the gene body to that in the 3′ end of the gene to 5000 bp downstream for clusters tuPAC and sstPAC. *p-value = 0.0176, two-sided Wilcoxon matched-pairs signed rank test. Median value is indicated by the horizontal, center black line. The first and third quartile are indicated by the minima and maxima of the boxplot. Whiskers represent 10–90 percentile. n = 4 biologically independent samples. Source data are provided as a Source data file. f, g Gene ontology analysis for tuPAC (f) and sstPAC (g) from the heatmap in (c). Gene ontology processes are ranked by Benjamini–Hochberg adjusted p-value and the ratio of the number of genes in each gene ontology to the number of total genes in each cluster. Statistical testing was performed with an over representation analysis (ORA) using a one-sided Fisher’s exact test.

