
Fig. 2.
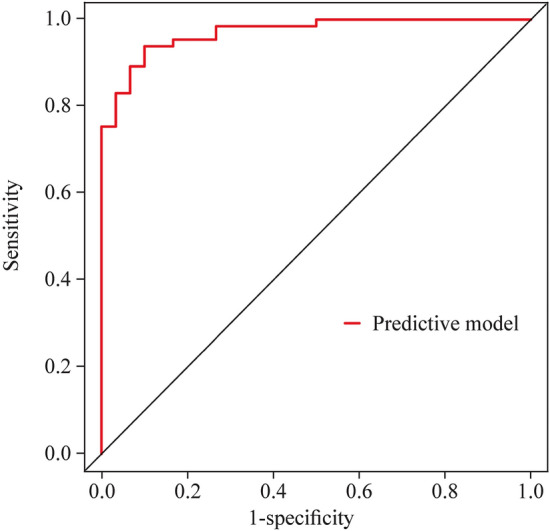
An ROC analysis of the nomogram for evaluating the effectiveness of metoprolol in POTS in children in the training set. The y-axis represents the sensitivity to predict the response to metoprolol; the x-axis represents the specificity to predict the response to metoprolol. The 45° reference line of the chart indicates that the sensitivity and the specificity are equal to 50%. The area under the curve was 0.970 with a 95% confidence interval of 0.942–0.998. ROC receiver-operating characteristic curve, POTS postural tachycardia syndrome, AUC area under the curve