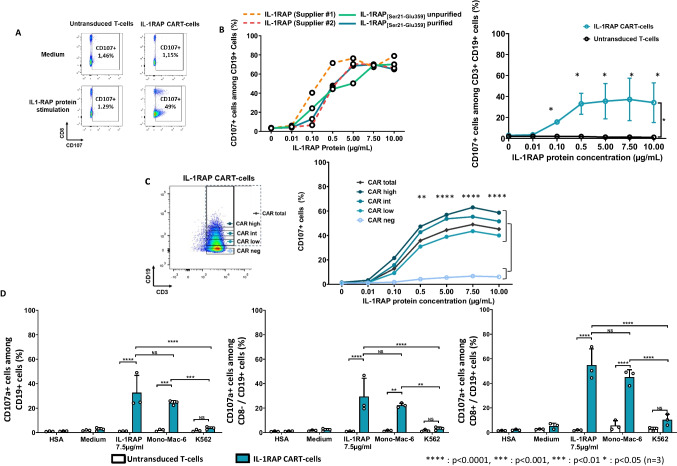
Fig. 2.
CD107a expression of IL-1RAP-CAR T-cells after stimulation with rIL-1RAP. A Representative flow cytometry analysis of CD107a degranulation assay. Untransduced T-cells and IL-1RAP-CAR T-cells were co-cultured (with or without the medium) with coated IL-1RAP protein for 6 h. CD107a+ cells staining was analyzed using flow cytometry gating on CD3+/CD19+ cells. B Left: Analysis of CD107a degranulation assay of CD19+ transduced T-cells after stimulation with different concentrations (0.01 up to 10 µg/ml) of rIL-1RAP from different suppliers (dotted lines) and our own rIL-1RAP in purified and unpurified forms (solid lines). Right: Percentage of total CD3+/CD19+/CD107a+ in untransduced or IL-1RAP-CAR T-cells co-cultured with different concentration of coated rIL-1RAP. Data are presented as mean ± SD for 3 independent experiments. C Left: Intensities of CD19 staining (negative, low, intermediate, or high) in transduced cell population (CD3+/CD19+) analyzed using flow cytometry. Right: Percentage of total CD3+/CD19+/CD107a+ or CD3+/CD19−/CD107a+ cells co-cultured with different concentration of coated rIL-1RAP. Data are presented as mean ± SD for 3 independent experiments. D CD107a degranulation assay for untransduced T-cells (white bars) and IL-1RAP-CAR T-cells (green bars) co-cultured at an E:T ratio of 1:5 for 6 h with target cells expressing or not expressing IL-1RAP (Mono-Mac-6 and K562, respectively) or co-cultured with coated rIL-1RAP (7.5 µg/ml). After 6 h, CD3+/CD19+/CD107a+ (left), CD3+/CD19+/CD8−/CD107a+ (middle), and CD3+/CD19+/CD8+/CD107a.+ (right) cells were analyzed using flow cytometry. Data are presented as mean ± SD for 3 independent experiments. ****p < 0.0001, ***p < 0.001, **p < 0.01, *p < 0.05

