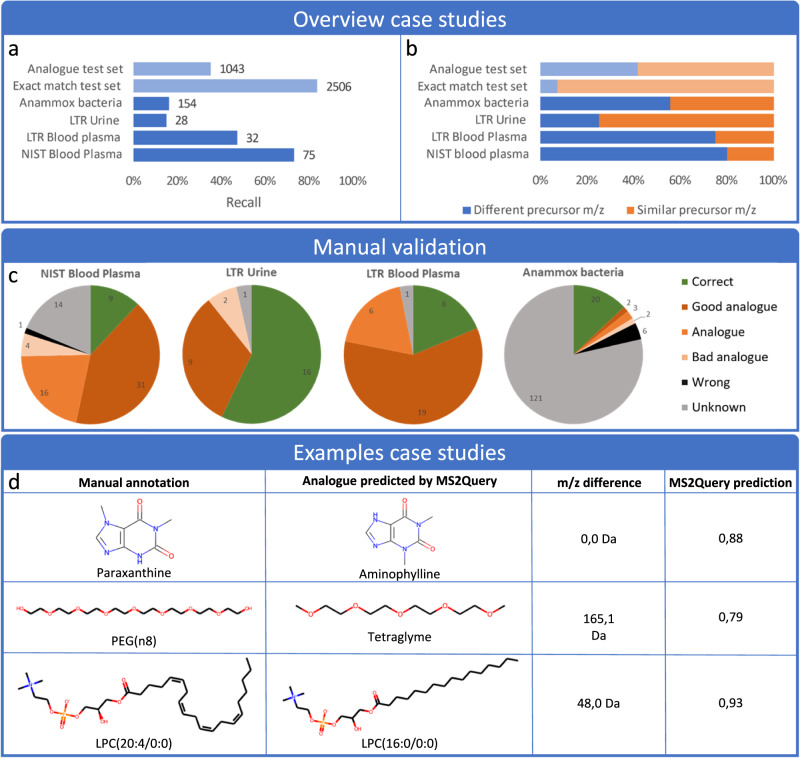
Fig. 3. Highlights of the results of the case studies.
The same MS2Query model was used for all test sets, for more details about the model used for the case studies, see Supplementary Note 1. A minimal threshold of 0.633 for the random forest score was used to determine if an analogue was selected. The threshold of 0.633 was selected, since this resulted in a recall of 35% for the “analogue test set”. Source data are provided as a Source Data file. a The variation of recall across case studies using the same settings. b The percentage of query spectra with a predicted analogue (precursor m/z > 1 Da) is compared to the percentage of spectra with an exact match predicted (precursor m/z < 1 Da) c Results were manually validated based on the retention time MS1 mass and MS2 spectra, by comparing to online libraries or in-house reference standards. These reference standards were used to judge the quality of the predicted analogues. In the Supplementary Note 6 more details about the validation can be found. For the anammox bacteria sample set, tentative validation was attempted for 50 features. d Three examples of predictions for mass spectra in the case studies. These examples came from the case study test sets LTR Urine, LTR Blood Plasma, and NIST Blood Plasma in that order. For LPC(20:4/0:0) the exact position of the double bonds could not be determined and was therefore guessed for the visualization.

