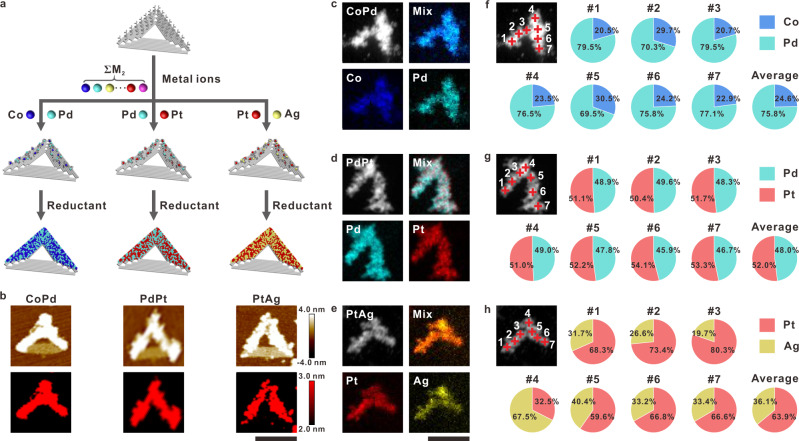
Fig. 4. Synthesis of various binary nanoparticles.
a Scheme depicting the process. Each colored ball represents a distinct metal ion or atom. b AFM images of the binary nanoparticle (CoPd, PdPt, PtAg) fabricated on two sides of a triangular DNA origami template. Second line shows tomography images of nanoparticles areas above the origami surface. Color scales of AFM images: from −4.0 to 4.0 nm. Color scales of cross-section images: from 2.0 to 3.0 nm. c–e HAADF-STEM images and EDS elemental mapping of each binary nanopattern on template: CoPd, PdPt, and PtAg. f–h Atomic percentage distributions for each element at different positions on a binary nanoparticle: CoPd (the average composition is Co (24.6 ± 4.0%), Pd (75.4 ± 4.0%)), PdPt (the average composition is Pd (48.0 ± 1.3%), Pt (52.0 ± 1.3%)), and PtAg (the average composition is Pt (63.9 ± 15.3%), Ag (36.1 ± 15.3%)). Scale bars: 100 nm. Source data are provided as a Source Data file.

