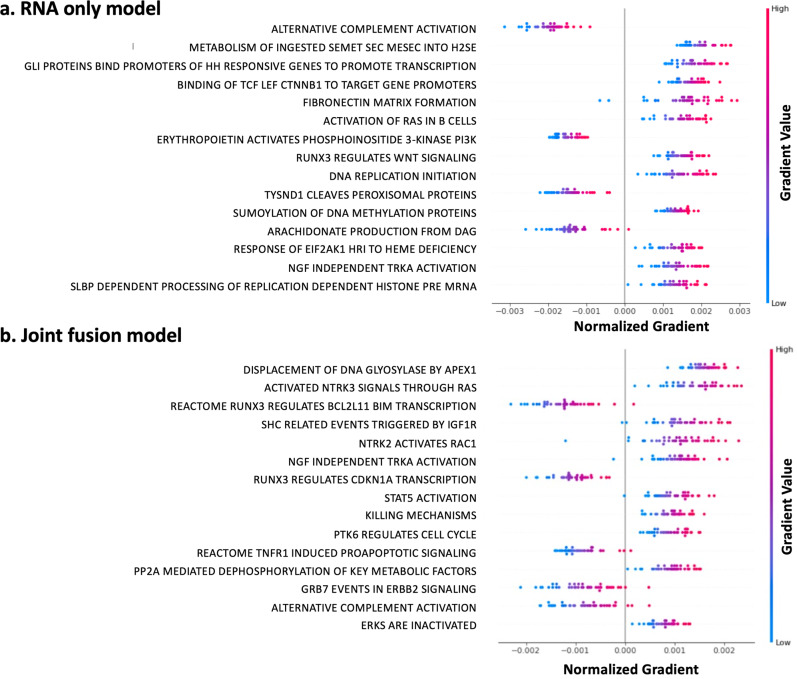
Fig. 6. Visualization of pathway importance with respect to survival predictions for the pediatric glioma cohort.
Pathways are ranked from top to bottom based on the sum of the absolute gradients across all samples. Negative gradients contribute to a lower risk score, while positive gradients lead to a higher risk score. a Top 15 pathways of the unimodal gene expression model (RNA only). b Top 15 pathways of the multimodal joint fusion model (histopathology + RNA data).

