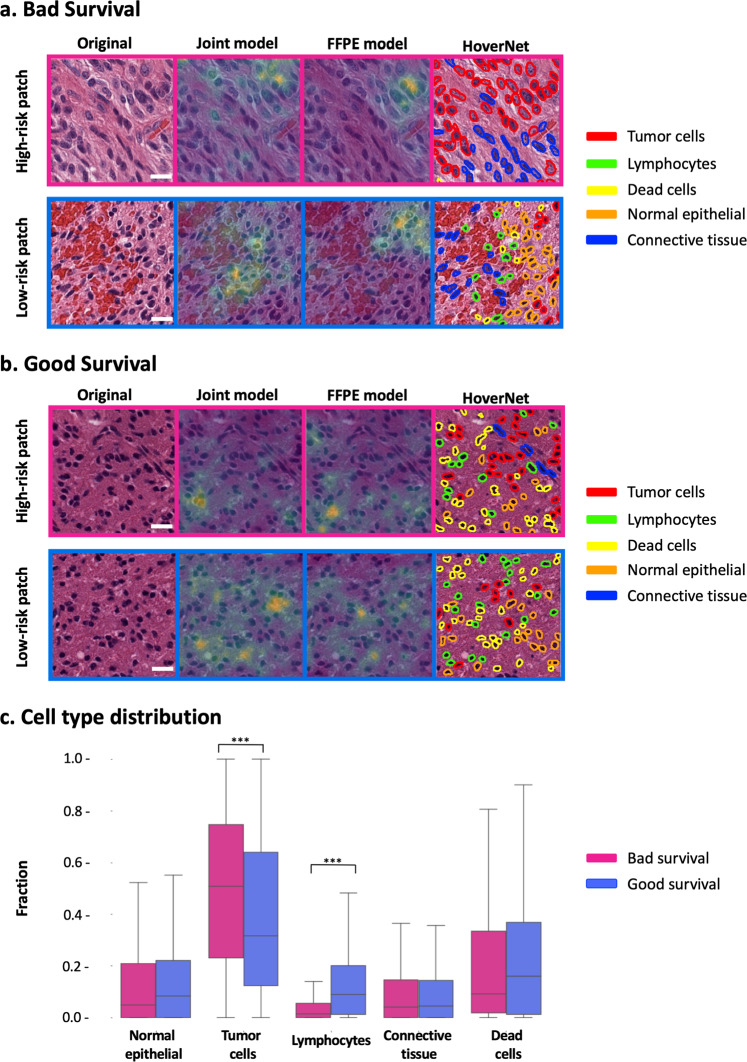
Fig. 7. Interpretability analysis of histopathology model with respect to survival predictions and cell type distributions.
a Examples of high-risk and low-risk patches for a bad survival sample. b Examples of high-risk and low-risk patches for a good survival sample. Left panel = original 224 × 224 patch, scale bars (white insets), 20 µm; middle panels = overlayed saliency map for joint fusion and histopathology (FFPE only) models, Right panel = cell segmentation predicted by HoverNet50. c Quantitative analysis of cell type composition in extracted 224 × 224 patches of bad survival and good survival samples of the adult glioma test set. (***P value < 2.2e-16, two sample t test, high-risk N = 78, low-risk N = 78).

