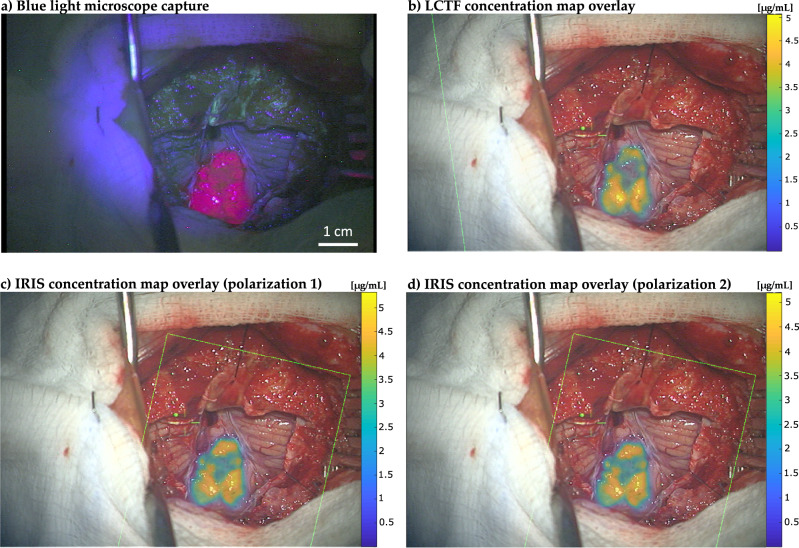
Fig. 4. Comparison of visual PpIX fluorescence and quantitative concentration maps imaged during neurosurgery.
a Visible fluorescence of PpIX illuminated under blue light. b PpIX concentration map generated from hyperspectral data acquired with the LCTF. c PpIX concentration map generated with IRIS using channels from the 1st polarization. d PpIX concentration map generated with IRIS using channels from the 2nd polarization. Concentration maps are overlaid on RGB images of the surgical field of view acquired with the Pentero operating microscope. Green box represents the field of view of the hyperspectral imaging system used to detect fluorescence. Color scale bars show imaged PpIX concentrations in micrograms per milliliter (μg/mL). Spatial scale bar (1 cm) appears in a).

