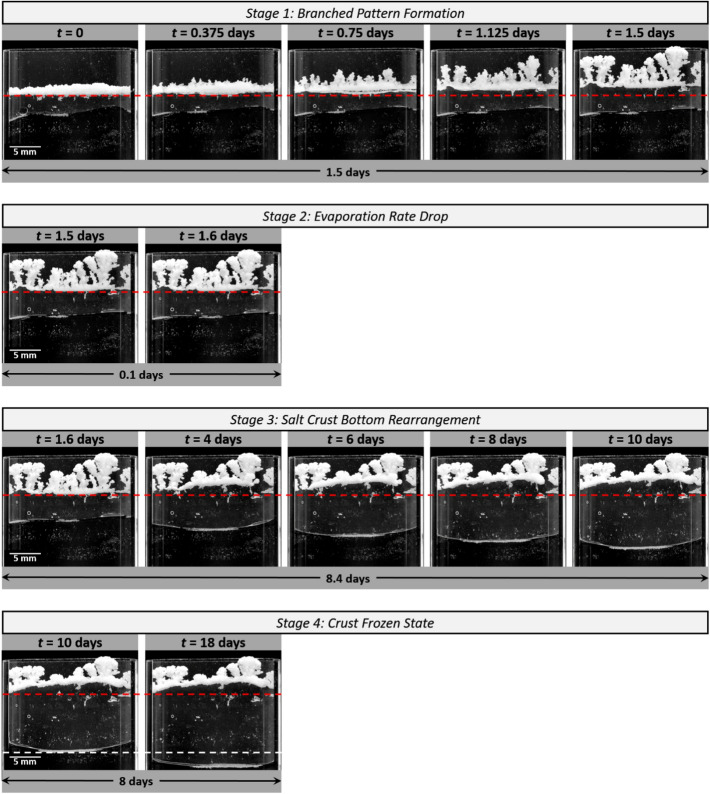
Figure 2.
Pictures of the salt crust in the Hele-Shaw cell. Illustration of the various stages in the evolution of the crust identified from both the crust morphology modification and evaporation rate variation. The red horizontal dashed lines are guide to the eye to see better the crust evolution and its upward migration. The white objects on the liquid–gas interface or attached to the walls (more visible in the supplementary movies) correspond to residual glass beads.

