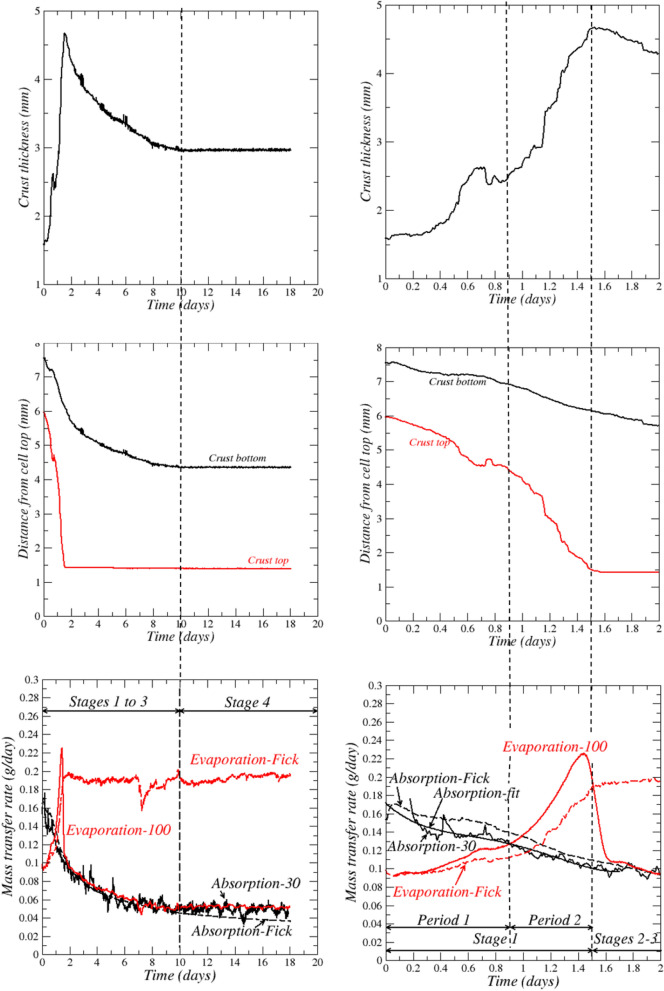
Figure 3.
Evolution of salt crust thickness, crust top and bottom surfaces mean positions, potential evaporation (“Evaporation–Fick”), absorption and evaporation rates. The solid curves labelled “Absorption-30”, “Absorption-Fit” and “Evaporation-100” correspond to measurements (see the “Materials and Methods” section for details on how these curves are obtained). The dashed curves labelled “Evaporation-Fick” and “Absorption-Fick” are determined from Fick’s law (see text). The figures in the right column are a zoom over the experiment first two days.

