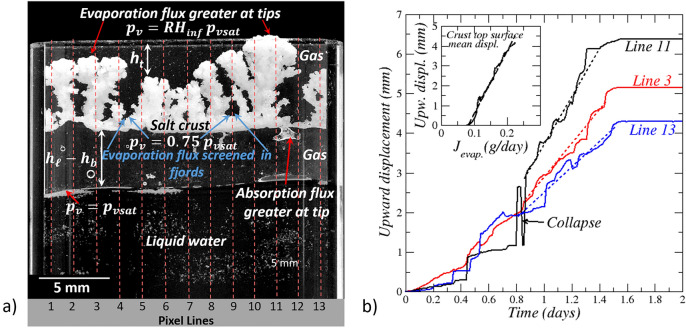
Figure 5.
Evaporation flux distribution in stage 2. (a) Schematic of evaporation flux distribution at crust top surface and absorption flux distribution at crust bottom surface during the salt crust destabilization period; vertical pixel lines considered in the image processing (see the “Materials and Methods “section). It can be noted that the distance can be locally equal to zero since some fingers reach the cell top. The average distance over the vertical lines shown in the figure is however greater than zero, (b) salt crust top surface displacement along lines 3, 11 and 13 (selected because corresponding to finger tips). The inset shows the crust top surface mean displacement as a function of the evaporation rate (up to day 1.5).

