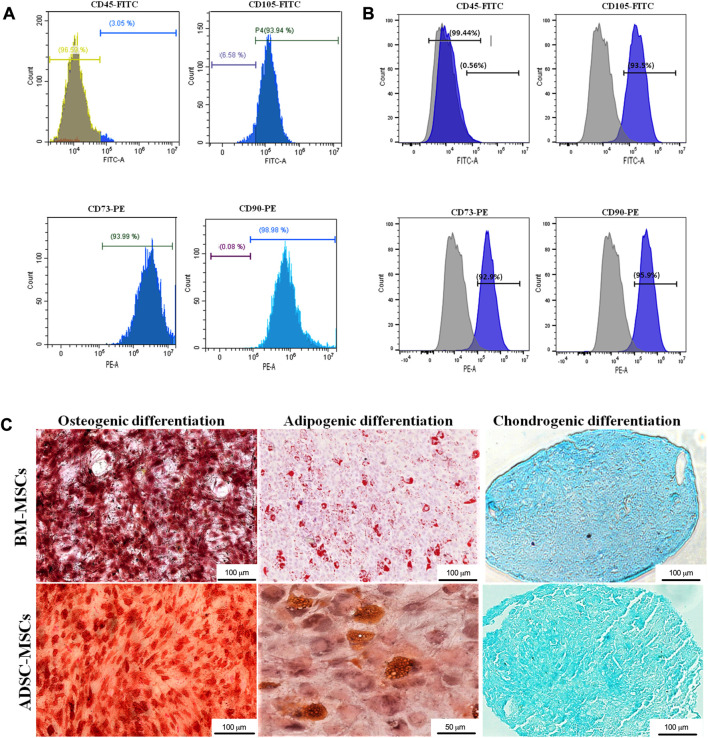
FIGURE 2.
Characterization of MSCs. BM-MSCs (A) and ADSCs (B) where characterized with flow cytometry through immunophenotype analysis of MSC cell surface markers CD45, CD105, CD73, CD90. (C) Osteogenic, adipogenic, and chondrogenic differentiation was determined by Alizarin red, Oil red O and Alcian blue staining, respectively (magnification: ×20, scale bars: 50 μm and 100 μm).

