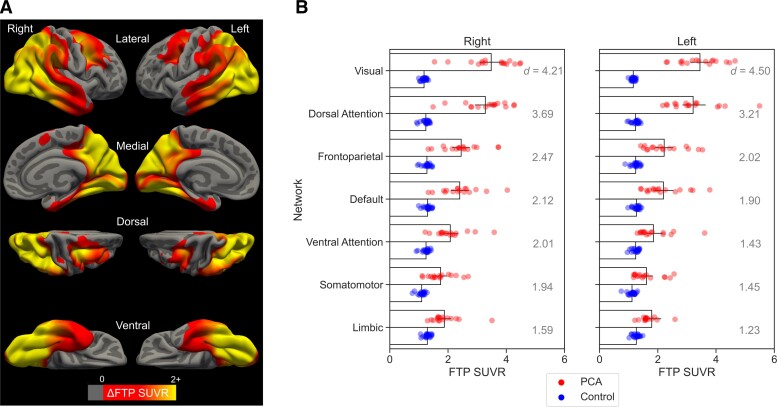
Figure 1.
Group comparison of FTP uptake between patients with PCA likely due to Alzheimer's disease (n = 17) versus Aβ− cognitively normal participants (n = 22). (A) Coloured vertices on the cortical surface map indicate areas where PCA patients had greater FTP SUVR then controls. (B) Bar plots represent the mean FTP SUVR values calculated for each of the seven canonical functional networks separately for each group. The networks are roughly ordered, from top to bottom, by the effect size (Cohen’s d) of between-group differences. All between-group comparisons are significant at P < 0.001. Coloured circles overlaid on the bar plot represent individual participants in each group.

