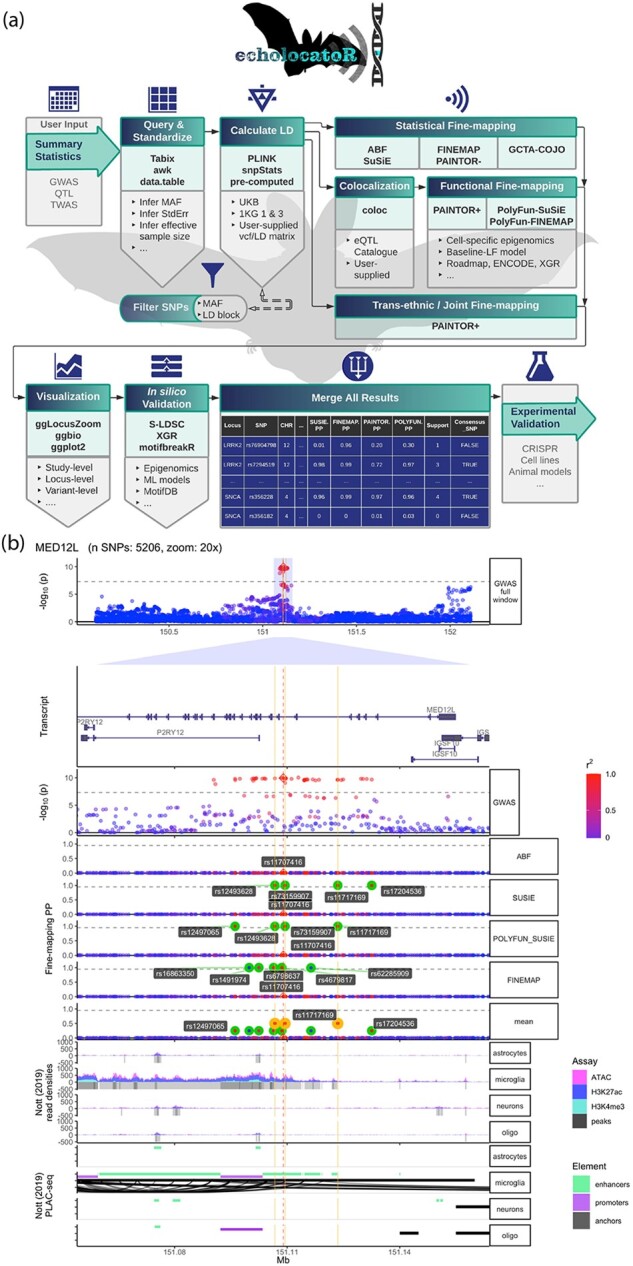
Fig. 1.

echolocatoR facilitates automated end-to-end fine-mapping. (a) Workflow of the echolocatoR pipeline: (i) user specifies the path to their full GWAS/QTL summary statistics, (ii) locus subsets are queried and saved in a standardized format, (iii) LD is extracted, computed from VCF or supplied by the user, (iv) statistical, functional and/or trans-ethnic/joint fine-mapping are performed, (v) results are visualized at study-, locus- and variant-level scales, (vi) in silico validation tests for differences in functional impact between SNP groups of interest, (vii) GWAS/QTL summary statistics, fine-mapping results and annotations are merged into a file with one SNP per row, (viii) narrowed SNPs lists can be targeted in validation experiments. (b) Example multi-track plot for the Parkinson’s Disease locus MED12L: (i) Manhattan plot of GWAS -log10(P-values) colored by the degree of correlation (r2) with the lead SNP, (ii) gene transcript models, (iii) GWAS -log10(P-values) zoomed in at 20×, (iv) per-SNP posterior probabilities (PP) from four different fine-mapping tools, (v) histogram and called peaks across multiple brain cell-type-specific epigenomic assays (Nott et al., 2019), (vi) cell-type-specific PLAC-seq interactions, PLAC-seq anchors, enhancers and promoters (Nott et al., 2019). The vertical red line indicates the location of the lead GWAS SNP, while the vertical gold lines indicate the location of Consensus SNPs
