Fig. 3.

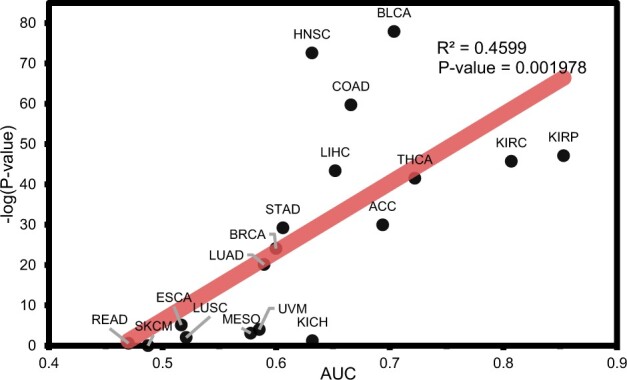
Relationship between the average area under the receiver operating characteristic curve (AUC) of inner cross-validation results in each TCGA cancer type and P-value in a paired t-test for the difference in turning the module attention on/off

Relationship between the average area under the receiver operating characteristic curve (AUC) of inner cross-validation results in each TCGA cancer type and P-value in a paired t-test for the difference in turning the module attention on/off