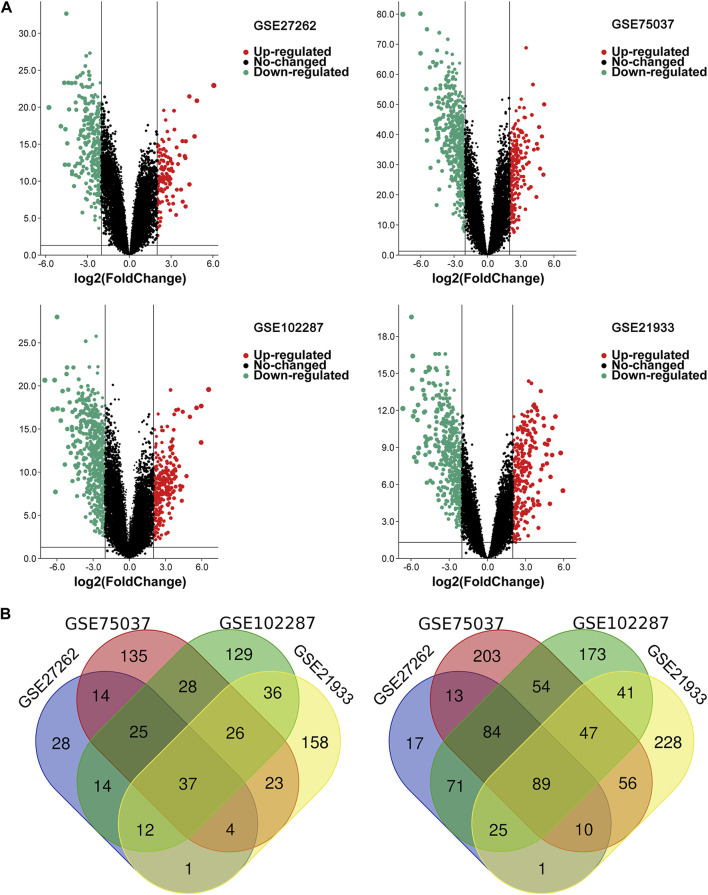
FIGURE 2.
The overlapping DEGs of the four gene expression datasets. (A) Volcano plots of each gene expression profiles in NSCLC and normal tissues. (B) Venn diagrams of DEGs. The one on the left refers to 37 upregulated DEGs; The right one refers to 89 downregulated DEGs; NSCLC, non-small cell lung cancer; DEG, differentially expressed gene.

