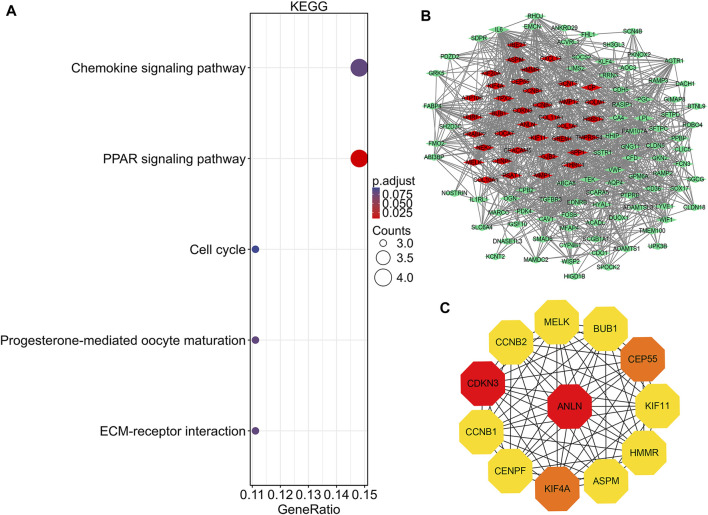
FIGURE 4.
KEGG pathway analysis, protein-protein interaction network construction, and module analysis. (A) Significantly enriched KEGG pathway terms of DEGs in NSCLC. (B) DEGs protein–protein interaction network complex. Red nodes refer to upregulated genes. Green nodes refer to downregulated genes. Edges represent protein-protein associations. (C) Top 12 key genes with high connectivity in the network. The shade of the color indicates the strength of the connection. NSCLC, non-small cell lung cancer; DEG, differentially expressed gene.

