FIGURE 3.
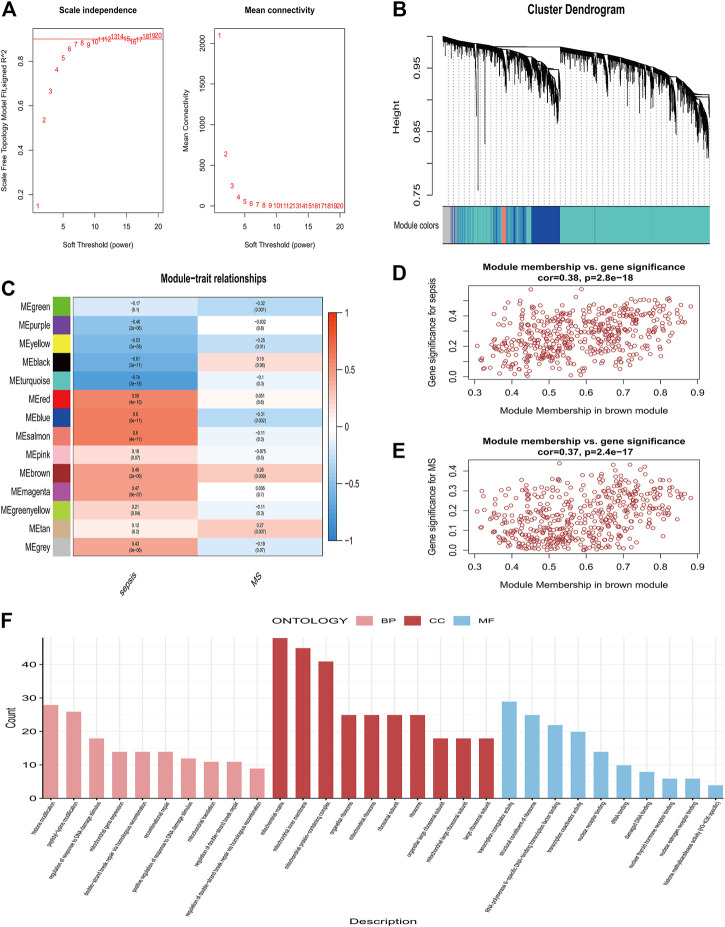
Co-expression modules and enrichment analysis in patients with Sepsis and MetS (A) Analysis of the network topology of soft threshold power (B) Cluster dendrogram identifying co-expressed genes in Sepsis and MetS (C) The module–trait relationships in Sepsis and MetS. Correlations and p-values are provided for each module (D) Correlation of brown modules with Sepsis (E) Correlation between brown modules and MetS (F) Analysis of GO enrichment for brown module genes.

